
About the RSI Indicator
The RSI indicator for MT4 is a classic momentum oscillator that measures the speed and change of price movements.
Developed by J. Welles Wilder, it fluctuates between zero and 100 to highlight overextended market conditions.
When the value moves to extremes, it indicates that a currency pair is either overbought or oversold.
This tool is a staple for traders across all styles, providing a reliable way to gauge the internal strength of a price move.
It helps in identifying potential reversal points by showing when the buying or selling pressure has reached an unsustainable level.
Free Download
Download the “RSI.mq4” MT4 indicator
Indicator Chart
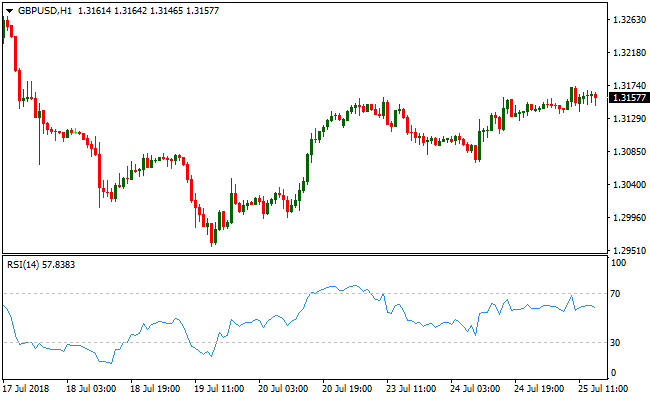
The chart features the RSI indicator in a separate window below the main price action.
It shows the oscillator line dipping below the 30 level to signal an oversold state and rising above 70 to indicate an overbought condition.
These levels serve as primary zones for anticipating a corrective move or a total trend reversal.
Guide to Trade with the RSI Indicator
Buy Rules
- Monitor the RSI indicator until the line drops below the 30 oversold level.
- Wait for the oscillator to cross back above the 30 level from below.
- Ensure the long-term moving average confirms an overall bullish trend.
- Open a buy order at the start of the next bullish candle.
Sell Rules
- Monitor the RSI indicator until the line rises above the 70 overbought level.
- Wait for the oscillator to cross back below the 70 level from above.
- Ensure the long-term moving average confirms an overall bearish trend.
- Open a sell order at the start of the next bearish candle.
Stop Loss
- Place the stop loss 2- 5 pips below the recent swing low for buy positions.
- Place the stop loss 2-5 pips above the recent swing high for sell positions.
- Keep the stop loss at a distance that accounts for average daily volatility.
Take Profit
- Close the trade when the RSI reaches the opposite extreme level.
- Exit if the price hits a major historical support or resistance zone.
- Use a fixed profit target based on a 1:2 risk-to-reward ratio.
RSI Indicator and Fibonacci MTF Channel Forex Trend Strategy for MT4
This MT4 forex strategy combines the RSI Relative Strength Index Indicator with the Fibonacci MTF Channel Indicator to capture entries that align with both momentum and trend direction.
The Fibonacci MTF Channel helps identify the overall market bias by showing an upward slope for bullish conditions and a downward slope for bearish conditions.
The RSI indicator signals potential entry points when it moves out of oversold territory for buys or drops back down from overbought levels for sells.
This approach works well on timeframes such as M15 and H1 where intraday moves have enough room to develop while still offering frequent setups.
It works most effectively on major and cross currency pairs such as USDJPY, EURJPY, GBPJPY, EURAUD, and NZDUSD, where the trend and RSI signals tend to align clearly and produce more reliable trading opportunities during the day.
Buy Entry Rules
- The Fibonacci MTF Channel indicator must be upward sloping, indicating a bullish trend.
- The RSI must fall below 30 and then rise back above 30, signaling a recovery from oversold conditions.
- Enter a buy trade at the close of the candle where the RSI crosses above 30 while the channel remains bullish.
- Place a stop loss below the nearest swing low or just below the lower channel boundary to limit risk.
- Exit the trade when the RSI enters overbought territory (above 70) followed by a drop back below 70, or when the channel flattens or turns downward.
Sell Entry Rules
- The Fibonacci MTF Channel indicator must be downward sloping, indicating a bearish trend.
- The RSI must rise above 70 and then fall below 70, signaling exhaustion of bullish pressure and a shift toward bearish momentum.
- Enter a sell trade at the close of the candle where the RSI crosses below 70 while the channel remains bearish.
- Place a stop loss above the nearest swing high or just above the upper channel boundary to manage risk.
- Exit the trade when the RSI falls into oversold territory (below 30) followed by a rise back above 30, or when the channel flattens or turns upward.
Advantages
- Aligns momentum signals from RSI with the prevailing trend direction shown by the Fibonacci MTF Channel.
- Helps avoid countertrend trades by requiring trend confirmation first.
- Flexible exit rules let you stay in strong moves until momentum weakens.
- Applicable to multiple major forex pairs and suitable for M15 and H1 timeframes.
- Helps capture intraday swings without overtrading minor price noise.
Drawbacks
- RSI signals can lag in fast, volatile markets causing delayed entries.
- Trend may flatten shortly after entry, resulting in early exits or smaller profits.
- During sideways markets, signals can give whipsaws if the channel does not remain consistent.
- Requires patience to wait for both trend direction and RSI confirmation to align.
Case Study 1
On USDJPY H1 during the Tokyo to London overlap, the Fibonacci MTF Channel showed a consistent upward slope as price remained above higher channel bands.
During a mild pullback, the RSI dipped below 30 and later crossed back above 30, signaling renewed buying interest.
A long entry was taken at the close of the confirming candle.
Price continued higher and ultimately reached a zone where RSI entered overbought territory and then dipped back below 70, signaling an exit.
This move resulted in a gain of approximately 40 pips before market momentum began to slow.
Case Study 2
On EURAUD M15 during the London session, the Fibonacci MTF Channel was clearly downward sloping as price maintained lower lows and lower highs.
RSI rose above 70, signaling a brief retracement within the downtrend, and then fell back below 70 confirming bearish continuation.
A short trade was entered at the close of that candle.
Price continued lower for roughly 35 pips before RSI entered oversold territory and then rose back above 30, indicating it was time to exit.
The stop loss above the recent swing high was not tested during this move.
Strategy Tips
- Only take buy signals when the Fibonacci MTF Channel shows a clear upward slope and sell signals when it is clearly downward sloping.
- Wait for clean RSI crosses back above 30 for buys and below 70 for sells to avoid false signals in choppy ranges.
- Aim to trade during major session overlaps for stronger trend moves and more reliable signals.
- Adjust stop loss placement based on recent swing points and channel boundaries rather than fixed pip amounts.
- Be patient and allow trades time to develop; avoid closing too early if momentum remains strong.
- If the channel starts to flatten after entry, consider tightening stops to protect profits.
Download Now
Download the “RSI.mq4” Metatrader 4 indicator
FAQ
What is the significance of the 50 level in RSI?
The 50 level acts as a trend separator.
Generally, when the RSI indicator is above 50, the market bias is bullish, and when it is below 50, the bias is bearish.
Many traders use the 50-line crossover as an additional confirmation for trend direction.
Why should I use a moving average with the RSI?
RSI signals are most effective when taken in the direction of the primary trend.
A moving average helps you filter out counter-trend signals, such as selling in a strong uptrend, which reduces the number of losing trades during aggressive market runs.
Can the RSI stay overbought for a long time?
Yes. In a very strong trend, the RSI indicator can remain above 70 or below 30 for extended periods.
This is why it is essential to wait for the line to cross back into the neutral zone before executing a reversal trade.
Summary
The RSI indicator is a fundamental utility for identifying market extremes and momentum shifts.
Its primary benefit is the ability to signal when a move has become overextended, allowing traders to enter at more favorable price points.
By combining its oversold and overbought readings with a trend-following filter, you can significantly improve the reliability of your signals.
It remains one of the most effective and user-friendly tools for maintaining a disciplined approach to market entries and exits across any asset class.


