About the Fibonacci Spiral Indicator
The Fibonacci Spiral indicator for MT4 is a technical analysis tool that plots Fibonacci levels in the form of a spiral directly on the price chart.
Instead of using standard horizontal retracement lines, this indicator applies the Fibonacci concept dynamically, following price movement as it unfolds.
The spiral is based on the 1.618 golden ratio, a key Fibonacci value widely used in financial markets.
By projecting this ratio in a spiral form, the indicator helps traders identify potential turning points where price may react, stall, or reverse.
These areas often align with natural market rhythm and momentum shifts.
Once loaded on the chart, the indicator automatically draws the spiral and changes color depending on market direction.
This makes it easier to spot opportunities that align with the underlying trend, while avoiding trades against prevailing market pressure.
Free Download
Download the “FX5_FiboSpiral_v1_0.mq4” MT4 indicator
Key Features
- Plots Fibonacci levels as a spiral on the chart.
- Uses the 1.618 golden ratio for calculations.
- Highlights potential market turning points.
- Color-coded spirals for buy and sell conditions.
- Simple visual signals that are easy to interpret.
- Works on all currency pairs and timeframes.
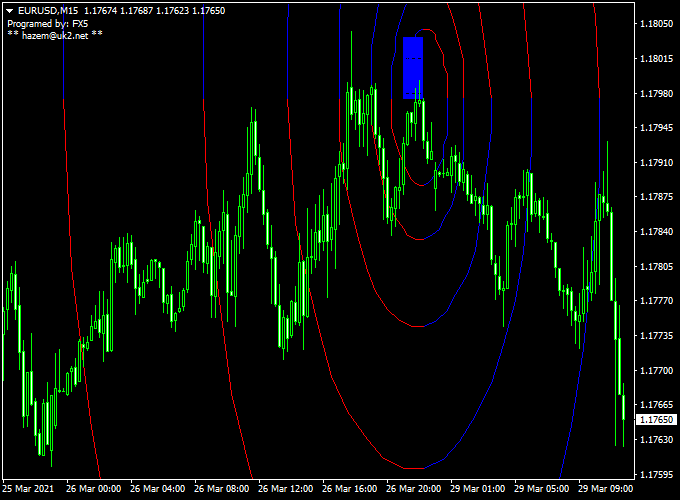
Indicator Chart
Example chart showing the Fibonacci Spiral indicator applied to a forex market.
The chart displays a blue or red Fibonacci Spiral plotted around recent price action.
Traders can observe how price reacts near the spiral curves, helping identify possible buy or sell zones in line with the prevailing trend.

Guide to Trade with the Fibonacci Spiral Indicator
Buy Rules.
- Confirm the overall market trend is upward.
- Wait for a blue Fibonacci Spiral to appear on the chart.
- Open a buy trade as price reacts positively around the spiral.
Sell Rules.
- Confirm the overall market trend is downward.
- Wait for a red Fibonacci Spiral to appear on the chart.
- Open a sell trade as price reacts negatively around the spiral.
Stop Loss.
- Place the stop loss 2 to 3 pips below short-term support for buy trades.
- Place the stop loss 2 to 3 pips above short-term resistance for sell trades.
Take Profit.
- Apply a personal take profit strategy based on market conditions.
- Close the trade when an opposite spiral signal appears.
Fibonacci Spiral + Super Half Trend Indicator Forex Strategy for MT4
This strategy uses the Fibonacci Spiral Forex Indicator for MT4, which draws a spiral based on Fibonacci ratios from a strong swing point to project time-price intersection zones.
It is paired with the Super Half Trend Forex Indicator for MT4 (essentially a variation of the Half Trend concept) that gives clear buy (blue arrow) and sell (red arrow) signals when trend shifts occur.
It is designed for day-traders who want defined entry and exit rules using intraday charts (M15 or M30) on major forex pairs like EURUSD, GBPUSD, or USDCHF.
The strategy works best during active sessions when clear swings occur, because the spiral highlights likely inflection zones and the Super Half Trend signal gives the directional trigger.
Buy Entry Rules
- On your chart, identify a recent strong swing low and ensure the Fibonacci Spiral indicator is anchored to it, so you see a spiral arc projecting ahead into time and price.
The spiral marks potential turning zones where price/time confluence suggests a bounce. - Wait for the Super Half Trend indicator to issue a blue arrow, signalling a bullish trend shift (price transition into up-trend).
- Confirm that the current price is approaching or inside a spiral zone (time-price intersection) where historically the price may reverse or accelerate upward.
- Enter a buy trade at the close of the candle that gives the blue arrow and lies within or near the spiral projection zone.
- Set the stop loss just below the recent swing low or just outside the lower boundary of the spiral arc (for example, 15-20 pips, depending on pair/timeframe).
- Set the take profit target at the next major spiral arc intersection or when the Super Half Trend indicator turns red (sell arrow) — aim for a risk-reward ratio of at least 1:2.
Sell Entry Rules
- Anchor the Fibonacci Spiral from a recent strong swing high and observe the projected time-price zone where the spiral suggests a possible reversal.
- Wait for the Super Half Trend indicator to issue a red arrow, signalling a bearish trend shift.
- Confirm that the price is approaching or within the spiral’s projection zone, indicating an elevated probability of a downward move.
- Enter a sell trade at the close of the candle that gives the red arrow within/near the spiral zone.
- Set the stop loss just above the recent swing high or outside the upper boundary of the spiral arc (e.g., 15-20 pips).
- Set take profit at the next spiral intersection target or when the Super Half Trend indicator flips blue — again aim for risk-reward of at least 1:2.
Advantages
- Combines a geometric/time-price tool (Fibonacci Spiral) with a clear trend-shift trigger (Super Half Trend arrow) for higher-probability entries.
- Helps locate “when and where” price may move, by using spiral projection zones.
- Well-suited for day-trading intraday charts with defined stop/target levels.
Drawbacks
- The Fibonacci Spiral requires manual anchoring and interpretation; mis-anchoring may lead to worthless zones.
- The strategy demands discipline to wait for both conditions (spiral zone + arrow) — skipping trades when they misalign is necessary.
Example Case Study 1: GBPUSD M15 Session
During the London morning session, GBPUSD formed a strong swing low at 1.2380.
A Fibonacci Spiral was anchored to that low and projected forward; the next arc zone fell around 1.2425 in late morning.
As the price approached that zone, the Super Half Trend indicator gave a blue arrow at 1.2410 on the M15 chart.
A buy trade was entered at 1.2410, stop loss at 1.2390 (20 pips) below the swing low, target set at 1.2450 (40 pips) where the spiral arc projected.
Price rallied through the arc zone and hit the target.
Example Case Study 2: USDCHF M30 Session
In the New York afternoon, USDCHF had a strong swing high at 0.9150.
A Fibonacci Spiral anchored to that high projected a reversal zone around 0.9110.
On the M30 chart, the Super Half Trend indicator issued a red arrow at 0.9125.
A sell trade was entered at 0.9125, stop loss set at 0.9145 (20 pips) above the swing high, target at 0.9085 (40 pips) at the next spiral arc.
The move played out and reached the target later in the session.
Strategy Tips
- Make sure you anchor the spiral from a solid swing high or low — avoid weak or noisy structures.
- Prefer trading during higher-volume sessions (London & New York) when directional moves are more reliable.
- If the price is too far from the spiral zone when the arrow appears, skip the trade; the confluence matters.
Download Now
Download the “FX5_FiboSpiral_v1_0.mq4” MT4 indicator
FAQ
What makes the Fibonacci Spiral different from standard Fibonacci tools?
Unlike horizontal retracement levels, the Fibonacci Spiral adapts to price movement by following a curved path.
This helps identify dynamic reaction zones rather than fixed price levels.
How reliable are the spiral turning points?
The spiral highlights areas where price often reacts, but it works best when combined with trend analysis or additional confirmation tools.
Is the Fibonacci Spiral suitable for short-term trading?
Yes. The indicator can be used on lower timeframes for intraday trading as well as higher timeframes for swing and position trading.
Summary
The Fibonacci Spiral indicator for MT4 offers a unique way to apply Fibonacci analysis through a spiral-based approach.
Using the 1.618 golden ratio helps traders identify potential turning points with strong market relevance.
Its color-based signals, adaptability across timeframes, and ease of interpretation make it a practical tool for traders looking to refine entries and exits.
When combined with solid trend analysis, the Fibonacci Spiral can enhance timing and overall trade confidence.


