
About the Forex Mini Charts MTF Indicator
The Forex Mini Charts MTF Indicator for Metatrader 4 is designed to help traders monitor multiple currency pairs from a single, organized trading window.
It displays compact mini charts that update in real time, allowing traders to track price movement and trend behavior without constantly changing charts.
This approach supports faster decision-making and better market awareness during active trading sessions.
Alongside price action, the indicator includes a triple moving average setup that can be fully customized.
These moving averages make it easier to assess trend direction and strength across different instruments.
By combining multi-timeframe analysis with moving average confirmation, traders gain a broader market perspective while maintaining a focused trading environment.
Free Download
Download the “forex-mini-chart-indicator-mtf.ex4” MT4 indicator
Key Features
- Displays multiple mini charts in a separate window.
- Multi-timeframe capable for broader market insight.
- Includes three configurable moving averages.
- Helps compare trends across different currency pairs.
- Supports trend confirmation and directional bias.
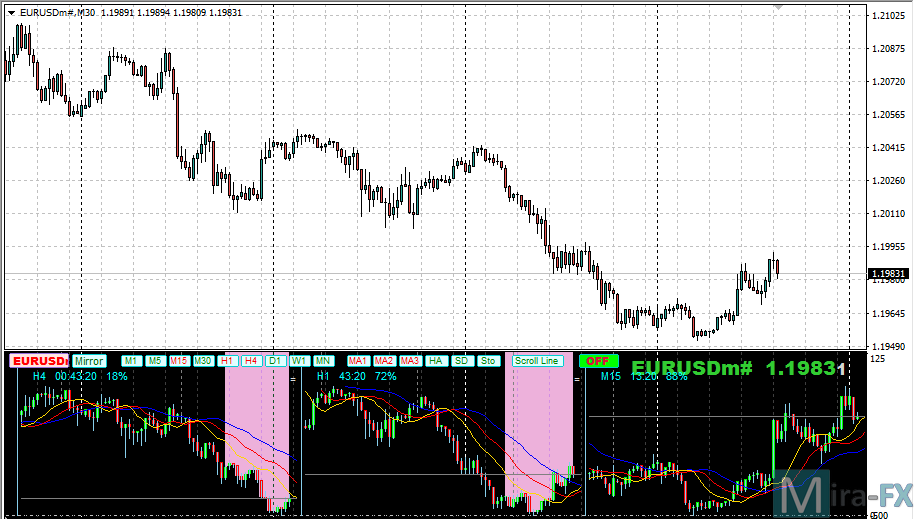
Indicator Chart
The Forex Mini Charts MTF Indicator appears in a dedicated subwindow below the main chart.
Each mini chart shows live price action along with the selected moving averages.
The layout makes it easy to spot trend alignment, strong momentum shifts, and potential trade opportunities across multiple instruments.
Guide to Trade with Forex Mini Charts MTF Indicator
Buy
- Open a buy trade when price crosses above all three moving averages from below.
- Confirm that the moving averages are starting to fan out in a bullish direction.
- Check that at least two mini charts show the same upward bias.
Sell
- Open a sell trade when price crosses below all three moving averages from above.
- Confirm that the moving averages are beginning to separate to the downside.
- Check that at least two mini charts show the same bearish bias.
Stop Loss
- Place the stop loss below the most recent swing low for buy trades.
- Place the stop loss above the most recent swing high for sell trades.
- Widen stops slightly when trading higher timeframes.
Take Profit
- Set take profit near the next major support or resistance zone.
- Close partial positions when price shows weakness on the mini charts.
- Let profits run if multiple charts maintain trend alignment.
Forex Mini Charts MTF + Ashi Trend Signal Forex Strategy for MT4
This strategy combines the Forex Mini Charts MTF Indicator for MT4 and the Ashi Trend Signal MT4 Indicator.
The Mini Charts MTF indicator allows traders to view multiple timeframes at a glance in a separate window, giving a clear perspective of trend direction across multiple timeframes.
The Ashi Trend Signal provides precise entry signals with blue arrows for buy trades and red arrows for sell trades.
By combining these two indicators, traders can align entries with multi-timeframe trends and capture high-probability intraday trades.
This strategy works best on M15, H1 and H4 charts, targeting major currency pairs during active sessions.
It is suitable for day traders who want to monitor multiple timeframes efficiently while using clear entry signals to take advantage of trending market conditions.
Buy Entry Rules
- Confirm the overall trend is bullish across at least two higher timeframes in the Mini Charts MTF window.
- Wait for the Ashi Trend Signal to display a blue arrow on the current trading timeframe.
- Enter a buy trade immediately after the blue arrow appears.
- Place a stop-loss a few pips below the recent swing low or below a key support level.
- Set take-profit near the next significant resistance or pivot, or exit when a red arrow appears on the Ashi Trend Signal or when higher timeframes show a weakening trend.
Sell Entry Rules
- Confirm the overall trend is bearish across at least two higher timeframes in the Mini Charts MTF window.
- Wait for the Ashi Trend Signal to display a red arrow on the current trading timeframe.
- Enter a sell trade immediately after the red arrow appears.
- Place a stop-loss a few pips above the recent swing high or a key resistance level.
- Set take-profit near the next significant support or pivot, or exit when a blue arrow appears on the Ashi Trend Signal or when higher timeframes show a weakening trend.
Advantages
- Allows multi-timeframe analysis at a glance, helping traders identify strong trends.
- Clear entry signals via Ashi Trend arrows reduce subjectivity and hesitation.
- Well-suited for day trading on H1 and H4 charts with major pairs.
- Helps avoid counter-trend trades by confirming trend alignment across multiple timeframes.
Drawbacks
- Fewer trades may occur because multi-timeframe alignment is required.
- Entry signals may lag slightly after arrow confirmation, especially on fast-moving pairs.
- Stop-loss and take-profit levels need to be adjusted carefully based on volatility.
Case Study 1 – EUR/USD H1
On 12 August at 10:00 GMT, the Mini Charts MTF showed bullish alignment on H4 and H1 charts.
The Ashi Trend Signal displayed a blue arrow at 1.1008.
A buy trade was entered at 1.1009. Stop-loss was placed at 1.0995 (14 pips risk).
Price moved in the direction of the trend and reached the next resistance at 1.1040 within 5 hours, capturing 31 pips.
The trade was closed when a red arrow appeared, signaling a potential reversal.
Case Study 2 – GBP/USD H1
On 14 August at 11:00 GMT, the Mini Charts MTF showed bearish alignment across H4 and H1 charts.
The Ashi Trend Signal displayed a red arrow at 1.2555.
A sell trade was entered at 1.2554. Stop-loss was set at 1.2570 (16 pips risk).
Price continued downward to 1.2515 over the next 6 hours, generating 39 pips profit.
The trade was closed when a blue arrow appeared, signaling a trend shift.
Strategy Tips
- Focus on major pairs with tight spreads and high liquidity for better execution.
- Always confirm trend alignment on at least two higher timeframes before entering trades.
- Use recent swing highs/lows or pivot points for precise stop-loss placement.
- Consider scaling out partially when the price approaches a major pivot or resistance/support.
- Use alerts for the Ashi Trend arrows to avoid missing fast trades on intraday charts.
Download Now
Download the “forex-mini-chart-indicator-mtf.ex4” Metatrader 4 indicator
FAQ
How many mini charts can be displayed at once?
The number of mini charts depends on your platform performance and screen size.
Most traders use between four and eight charts for optimal readability.
Can I use different timeframes for each mini chart?
Yes, the indicator supports multi-timeframe analysis, allowing you to monitor higher or lower timeframes alongside your main chart.
Are the moving averages customizable?
All three moving averages can be adjusted in the inputs, including period, method, and applied price.
Is this indicator suitable for beginners?
Yes, the visual layout and moving average logic make it beginner-friendly while still offering advanced insights for experienced traders.
Summary
The Forex Mini Charts MTF Indicator for MT4 offers a convenient way to analyze multiple markets and timeframes without chart clutter.
By combining compact charts with a triple moving average system, it helps traders stay focused on trend alignment and momentum strength.
Its flexibility, ease of use, and analytical depth make it a valuable addition for traders who rely on comparative analysis and disciplined trend-following strategies.


