
About the Relative Momentum Index Forex Signal Indicator
The Relative Momentum Index Forex Signal Indicator for Metatrader 4 combines several powerful technical tools into one streamlined signal system.
It combines Momentum, RMI, and Jurik smoothing to produce reliable buy and sell indications that respond quickly to market changes without generating unnecessary noise.
This indicator is fully MTF-enabled, meaning you can display higher time frame signals on lower time frame charts.
This feature helps intraday traders align entries with broader market direction while keeping their setups simple.
The indicator plots a colored signal line in a bottom chart window, making it intuitive to use even for traders with minimal experience.
Its speed, responsiveness, and adaptability make it suitable for scalping, day trading, and short-term swing trading.
Free Download
Download the “relative-momentum-index-mtf-rmi.ex4” MT4 indicator
Key Features
- Combines Momentum, RMI, and Jurik components into a single indicator.
- MTF (multi-timeframe) signal capability.
- Fast and responsive buy/sell signal line.
- Useful for scalpers, day traders, and short-term strategies.
- Lightweight indicator that performs well on all pairs.
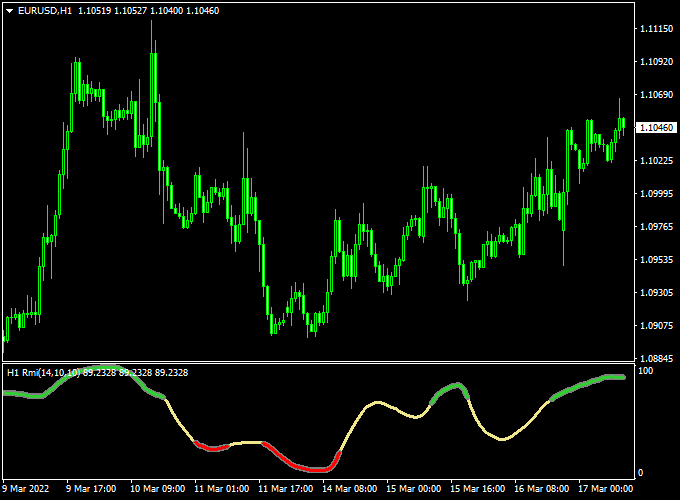
Indicator Chart
The Relative Momentum Index Forex Signal Indicator displays a color-changing signal line in a dedicated lower chart panel.
The chart highlights bullish phases with green signals and bearish phases with red signals, helping traders follow both momentum and trend strength with minimal chart clutter.
Guide to Trade with the Relative Momentum Index Forex Signal Indicator
Buy Rules
- Wait for the green signal line to appear in the indicator window.
- Open a buy trade after the signal candle closes.
- Ensure price is positioned above short-term support for added confirmation.
Sell Rules
- Wait for the red signal line to appear in the indicator window.
- Open a sell trade after the signal candle closes.
- Confirm price is below short-term resistance when possible.
Stop Loss
- Place stop loss 2 to 3 pips below short-term support for a buy trade.
- Place stop loss 2 to 3 pips above short-term resistance for a sell trade.
- Widen the stop slightly during volatile market sessions.
Take Profit
- Use a fixed risk-to-reward target of 1.5.
- Alternatively, close the trade when an opposite signal appears.
- Partial profit-taking can be beneficial when momentum weakens.
Relative Momentum Index + Kaufman Bands MT4 Intraday Forex Strategy
This intraday trading strategy combines the Relative Momentum Index Forex Signal Indicator for MT4 and the Kaufman Bands Indicator for MT4 to create a structured and efficient trading method for day traders.
The Relative Momentum Index (RMI) provides precise entry signals through color-coded changes — the green line represents a buy signal, while the red line indicates a sell signal.
The Kaufman Bands Indicator confirms the market trend with its adaptive band system, where the blue dotted line represents a bullish environment and the yellow dotted line shows a bearish one.
When used together, these two tools filter out false moves and highlight reliable intraday setups in trending conditions.
This strategy is best used on M15 and M30 charts for major pairs such as EURUSD, GBPUSD, and USDJPY.
It is ideal for traders who want to capture intraday swings while maintaining disciplined, rule-based entries and exits.
By aligning the RMI signal with the Kaufman Bands’ trend color, traders can focus only on high-probability setups that align with the main market direction.
Buy Entry Rules
- Wait for the Kaufman Bands dotted line to turn blue, confirming an uptrend.
- Check that the Relative Momentum Index line changes to green, indicating a buy signal.
- Enter a buy trade at the close of the candle that confirms both conditions.
- Set a stop loss just below the lower Kaufman Band or the recent swing low (usually 15–25 pips on M15).
- Set a take profit around 40–60 pips, depending on volatility and pair behavior.
Sell Entry Rules
- Wait for the Kaufman Bands dotted line to turn yellow, confirming a downtrend.
- Check that the Relative Momentum Index line changes to red, signaling bearish momentum.
- Enter a sell trade at the close of the candle that confirms both conditions.
- Set a stop loss just above the upper Kaufman Band or the latest swing high (usually 15–25 pips on M15).
- Take profit around 40–60 pips, or use a 1:2 risk-reward ratio for consistency.
Advantages
- Combines momentum confirmation (RMI) with adaptive trend direction (Kaufman Bands).
- Filters out countertrend trades and focuses only on confirmed setups.
- Simple to read — color-coded visuals make decision-making fast and clear.
- Works well in volatile intraday conditions with clear directional bias.
- Adaptable to multiple timeframes for day trading or short-term swing trading.
Drawbacks
- Less effective in sideways or range-bound markets where the bands flatten.
- Stop losses may be hit prematurely if volatility increases unexpectedly.
Case Study 1 – EURUSD (15-Minute Chart)
During the London session, EURUSD turned bullish as the Kaufman Bands dotted line changed to blue.
At the same time, the Relative Momentum Index line turned green, signaling a buy entry.
A trade was opened at 1.0855 with a 20-pip stop loss and a 45-pip take profit target.
The pair climbed steadily, reaching 1.0900 within two hours, resulting in a +45 pip gain.
Both indicators stayed aligned throughout the move, confirming the strength of the trend.
Case Study 2 – GBPJPY (30-Minute Chart)
Later in the New York session, GBPJPY displayed a strong bearish setup.
The Kaufman Bands dotted line switched to yellow, confirming a downtrend, and the Relative Momentum Index turned red at the same time.
A sell trade was taken at 191.30 with a 25-pip stop loss and 50-pip target.
Within the next 90 minutes, the price dropped to 190.80, reaching the take profit for a clean +50 pip result.
The color coordination between indicators provided a clear and low-stress signal.
Strategy Tips
- Always wait for the Kaufman Bands color to match the RMI signal color before entering a trade.
- Avoid trading when both indicators switch colors repeatedly — this suggests a range-bound market.
- Use major pairs with tight spreads for maximum efficiency.
- Secure partial profits once your trade reaches halfway to the target, and move the stop loss to breakeven to protect gains.
Download Now
Download the “relative-momentum-index-mtf-rmi.ex4” MT4 indicator
FAQ
What makes this indicator different from a standard Momentum or RMI indicator?
It blends Momentum, RMI, and Jurik filtering into one signal line, producing smoother and more actionable entries.
How does the multi-timeframe feature help?
It allows traders to view higher timeframe signals on a lower chart, improving alignment with broader market direction.
Which market conditions suit this indicator best?
It performs well in trending and semi-trending environments where momentum cycles are easy to follow.
Summary
The Relative Momentum Index Forex Signal Indicator for MT4 offers a refined approach to momentum trading by combining several technical methods into one efficient tool.
Its color-coded signals, MTF capability, and smooth responsiveness make it a strong option for traders seeking a disciplined entry method without excessive analysis.
Whether used alone or combined with trend filters, it delivers reliable guidance and adds valuable precision to short-term trading strategies.


