
About the RSI TMA Centered Bands Indicator
The RSI TMA Centered Bands Indicator for Metatrader 4 combines two well-known technical concepts into a single trading tool.
It merges the Relative Strength Index with centered Triangular Moving Average bands, allowing traders to analyze momentum and trend behavior at the same time.
Instead of switching between multiple indicators, traders can read RSI movement directly within dynamic TMA bands plotted in a bottom chart window.
This setup helps identify trend direction, momentum shifts, and potential continuation entries with greater timing accuracy.
The indicator is especially useful for short-term traders who rely on structured momentum signals while keeping their charts clean and responsive.
Free Download
Download the “rsi-tma-centered-bands-indicator.ex4” MT4 indicator
Key Features
- Combines RSI momentum with centered TMA bands.
- Displays trend slope and momentum in one indicator.
- Appears in a dedicated bottom chart window.
- Suitable for scalping and intraday trading.
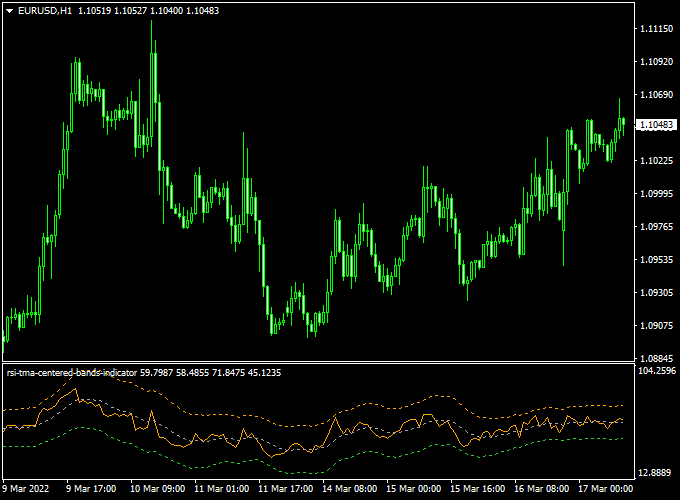
Indicator Chart
The RSI TMA Centered Bands indicator is displayed as TMA bands with an RSI line plotted inside the channel.
The chart highlights bullish and bearish momentum based on band slope and RSI position relative to the midline, helping traders align entries with trend strength.
Guide to Trade with RSI TMA Centered Bands Indicator
Buy Rules
- Confirm that the TMA bands are sloping upward.
- Wait for the brown RSI line to cross above the white dotted middle line.
- Open a buy trade after the crossover candle closes.
Sell Rules
- Confirm that the TMA bands are sloping downward.
- Wait for the brown RSI line to cross below the white dotted middle line.
- Open a sell trade after the crossover candle closes.
Stop Loss
- Place stop loss 1 to 3 pips below short-term support for buy trades.
- Place stop loss 1 to 3 pips above short-term resistance for sell trades.
- Adjust stop distance during high volatility sessions.
Take Profit
- Set a fixed risk-to-reward target of 1.5.
- Close the trade if an opposite signal forms.
- Scale out partial profits in strong trends.
RSI TMA Centered Bands + Legacy Trader Indicator Forex Scalping Strategy
This strategy uses the RSI TMA Centered Bands Indicator for MT4 and the Legacy Trader Indicator for MT4 to craft a scalping approach ideal for fast intraday moves.
The RSI TMA indicator gives a momentum-reversal signal when the brown RSI line crosses the dotted middle line while the TMA bands slope in the trend direction.
The Legacy Trader indicator supplies a clear trend filter via the aqua dotted line for bullish and magenta for bearish.
Combined, they allow you to scalp with both trend alignment and precise timing.
This works well on 5-minute and 15-minute charts for major pairs, especially during the London and New York sessions.
Buy Entry Rules
- Confirm the Legacy Trader dotted line is aqua (indicating bullish trend).
- Confirm the RSI TMA Centered Bands show the bands sloping upward.
- A buy trade is opened when the brown colored RSI line crosses above the white dotted middle line on the RSI TMA indicator.
- Enter on the close of the confirming candle.
- Set a stop loss a few pips below the most recent minor swing low or below the TMA band (for instance, 10-15 pips on a 5-minute chart).
- Set a take profit target of about 20-30 pips or use a risk-reward of 1:2, whichever aligns with pair volatility.
Sell Entry Rules
- Confirm the Legacy Trader dotted line is magenta (indicating bearish trend).
- Confirm the RSI TMA Centered Bands show the bands sloping downward.
- A sell trade is opened when the brown colored RSI line crosses below the white dotted middle line on the RSI TMA indicator.
- Enter on the close of the confirming candle.
- Set a stop loss a few pips above the most recent minor swing high or above the TMA band (for instance, 10-15 pips on a 5-minute chart).
- Set a take profit target of about 20-30 pips or use a risk-reward of 1:2, matching pair volatility.
Advantages
- Combines trend filter (Legacy Trader) with momentum reversal signal (RSI TMA), improving signal quality.
- Well-suited for fast intraday moves, giving clear entry and exit mechanics.
- Low complexity — just two indicators, clear rules, minimal ambiguity.
- Scalping on 5- or 15-minute charts means frequent opportunities during active sessions.
- Works across major currency pairs, making it flexible for different markets.
Drawbacks
- On very volatile pairs or near news releases, stop losses may get triggered before the move picks up.
- Smaller profit targets mean you need consistency because a few losses can wipe out gains quickly.
Case Study 1 – GBP USD, 5-Minute Chart
In the London session, GBP USD displayed a bullish trend as the Legacy Trader line turned aqua.
The RSI TMA Centered Bands sloped upward.
At one point, the brown RSI line crossed above the white dotted middle line.
A buy was entered at 1.2935, stop loss set at 1.2920 (15 pips), take profit target 1.2955 (20 pips).
Within 30 minutes, the price moved to the target, delivering +20 pips.
The trend filter and momentum crossover lined up well.
Case Study 2 – EUR JPY, 15-Minute Chart
During the New York session, EUR JPY shifted into bearish mode as the Legacy Trader line turned magenta and the RSI TMA Centered Bands began sloping downward.
The brown RSI line crossed below the white dotted middle line.
A sell was entered at 153.20, stop loss placed at 153.35 (15 pips), take profit set at 152.90 (30 pips).
The pair moved sharply within 45 minutes, achieving the take profit of +30 pips.
Momentum and trend alignment made this a clean scalp setup.
Strategy Tips
- Stick to major pairs with tight spreads (e.g., EUR USD, GBP USD, USD JPY) when scalping.
- Avoid entering immediately before major economic news — the indicators may give false signals in sudden spikes.
- Use the trend filter (Legacy Trader) as your main guard: skip signals that go against the colored trend line.
- On slower charts or less volatile pairs, extend stop loss and target accordingly (for example, 20-25 pips stop, 40-50 pips target on 15-minute chart).
- Always close or tighten your stop if the Legacy Trader line changes color mid-trade, indicating a trend reversal.
Download Now
Download the “rsi-tma-centered-bands-indicator.ex4” MT4 indicator
FAQ
What makes this indicator different from standard RSI?
It embeds RSI signals inside adaptive TMA bands, adding trend context to momentum readings.
Does the indicator repaint?
The RSI signals are stable, while TMA bands adjust smoothly as new price data forms.
Which timeframe works best with RSI TMA Centered Bands?
It performs well on M5 to H1 charts, especially during active market sessions.
Summary
The RSI TMA Centered Bands Indicator for MT4 offers a practical solution for traders who want momentum and trend analysis in one place.
Its combined approach helps filter low-quality signals and improves entry timing during trending conditions.
With simple rules, adaptable usage, and broad market compatibility, this indicator is a solid addition for traders seeking disciplined and responsive trade setups.


