About the Order Block Indicator
The Order Block Forex indicator for MetaTrader 4 is a price action tool designed to highlight potential reversal and reaction zones.
It focuses on identifying order blocks, which are areas where large market participants previously placed significant buy or sell orders.
These zones often act as strong support and resistance levels.
The indicator automatically scans price data and plots colored blocks directly on the chart.
Blue blocks represent potential buy-side order blocks and act as support.
Red blocks represent sell-side order blocks and act as resistance.
This visual approach helps traders focus on high-interest price areas without manual analysis.
The Order Block indicator is suitable for all trading styles.
It can be used for precise entries, exits, and overall trend confirmation.
Built-in alert options notify traders when new order blocks appear, making it easier to monitor multiple markets at once.
Free Download
Download the “order-block-forex-indicator.ex4” MT4 indicator
Key Features
- Automatically identifies buy and sell order blocks.
- Displays support and resistance zones directly on the chart.
- Includes alerts for new order block formations.
- Useful for both trade entries and exits.
- Works across all timeframes and instruments.
- Complements existing price action strategies.
Indicator Chart
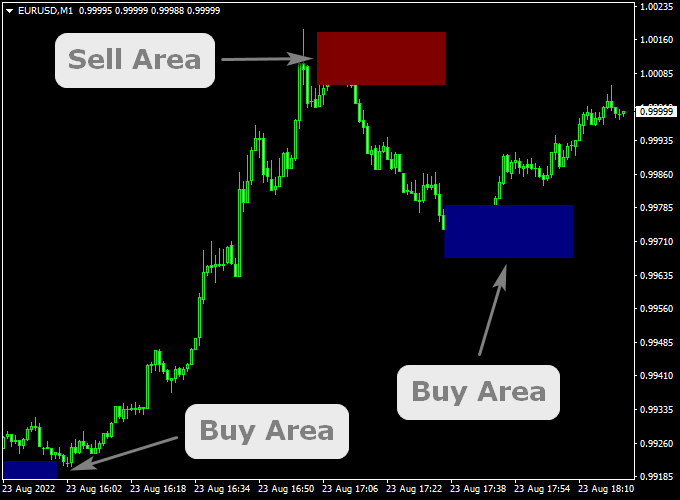
The chart below shows the Order Block indicator applied to a Forex price chart.
Blue order blocks highlight potential support zones, while red order blocks mark resistance areas.
Price reactions around these blocks often signal trading opportunities.

Guide to Trade with Order Block
Buy Rules
- Wait for the price to trade inside a blue order block.
- Look for price stabilization within the zone.
- Enter a buy trade after a bullish reaction.
Sell Rules
- Wait for the price to trade inside a red order block.
- Look for price rejection within the zone.
- Enter a sell trade after a bearish reaction.
Stop Loss
- Place the stop loss below the low of the blue order block for buy trades.
- Place the stop loss above the high of the red order block for sell trades.
Take Profit
- Target the opposite colored order block.
- Secure partial profits at intermediate price reactions.
Order Block + MACD Trend Histogram MT4 Forex Strategy
This Forex strategy combines the Order Block Forex Indicator for MT4 with the MACD Trend Histogram Bars Indicator for MT4.
The Order Block indicator highlights key support and resistance levels with blue (support) and red (resistance) blocks.
The MACD Trend Histogram provides momentum confirmation with green bars for bullish signals and red bars for bearish signals.
This strategy is ideal for M5, M15, and H1 charts for day trading and short-term trend trades.
Buy Entry Rules
- Identify a blue order block (support) on the chart.
- Confirm that the MACD Trend Histogram shows green bars, signaling bullish momentum.
- Enter a buy trade at the close of the confirmation candle within or near the support block.
- Set a stop loss just below the blue order block or recent swing low.
- Take profit at the nearest red order block (resistance) or when the MACD histogram turns red.
Sell Entry Rules
- Identify a red order block (resistance) on the chart.
- Confirm that the MACD Trend Histogram shows red bars, signaling bearish momentum.
- Enter a sell trade at the close of the confirmation candle near the resistance block.
- Set a stop loss just above the red order block or recent swing high.
- Take profit at the nearest blue order block (support) or when the MACD histogram turns green.
Advantages
- Combines key support/resistance levels with momentum confirmation for higher accuracy.
- Adaptable to multiple timeframes and currency pairs.
- Helps prevent trading against strong supply or demand zones.
Drawbacks
- Order blocks may occasionally fail in strong trending moves that break key levels.
Case Study 1 – EUR/JPY (M15 Chart)
On the EUR/JPY M15 chart, a blue order block formed at 142.50, indicating strong support.
The MACD Trend Histogram turned green, confirming bullish momentum.
A buy trade was entered at 142.52 with a 10-pip stop loss below the support block.
Price rallied to the next red order block at 143.10 within 45 minutes, generating +58 pips profit.
Case Study 2 – GBP/USD (M5 Chart)
On GBP/USD, a red order block appeared at 1.2730, signaling resistance.
The MACD histogram displayed red bars, confirming bearish momentum.
A sell trade was opened at 1.2728 with a stop loss at 1.2735.
The price dropped to the next blue order block at 1.2685, producing a +43 pips profit within 30 minutes.
The combination of resistance and momentum helped identify a strong short-term reversal.
Strategy Tips
- Focus on major pairs with high liquidity to reduce slippage.
- Use multiple timeframes to confirm that the trend aligns with the order block levels.
- Avoid trading during major news releases that can break order blocks unexpectedly.
- Consider scaling out of positions near strong order block zones to lock in profits.
- Maintain strict risk management, keeping risk per trade between 1–2% of account balance.
Download Now
Download the “order-block-forex-indicator.ex4” MT4 indicator
FAQ
What is an order block in Forex trading?
An order block represents a price zone where large buy or sell orders were previously executed.
These areas often attract future price reactions.
Does the Order Block indicator repaint?
Order blocks may update as market structure evolves.
This behavior reflects real-time price development rather than fixed historical levels.
Can this indicator be used for scalping?
Yes, it can be used on lower timeframes.
Smaller order blocks require tighter risk management.
Are alerts customizable?
Yes, the indicator includes multiple alert options that can be adjusted in the inputs tab.
Summary
The Order Block indicator provides traders with a powerful way to visualize institutional price zones.
Its blue and red blocks help define key support and resistance areas with practical trading relevance.
This improves both trade timing and risk management.
The indicator integrates well with any trading strategy and adapts to different market conditions.
With additional filtering or multi-timeframe options, its effectiveness could be further enhanced.
For traders focused on price action and market structure, the Order Block indicator is a valuable technical tool.


