
About the Vertex Forex Indicator
The Vertex indicator for MetaTrader 4 is a technical tool designed to identify precise turning points in market trends.
It belongs to the oscillator family but functions with a specific focus on trend exhaustion and reversal signals.
The primary benefit of the Vertex indicator is its ability to simplify complex trend analysis into color-coded bars.
It specifically looks for moments where a trend has reached a peak or trough and is likely to shift direction.
This makes it an ideal choice for traders who prefer a “reversal” style of trading or those looking for high-probability entry points at the start of a new market move.
Free Download
Download the “vertex.mq4” indicator for MT4
Key Features
- The indicator provides trend direction through a simple red and blue bar system.
- It identifies potential market reversals by analyzing price velocity and exhaustion.
- It functions as a standalone signal generator or a trend-following filter.
- The bars adjust dynamically to market volatility to provide timely signals.
Indicator Chart
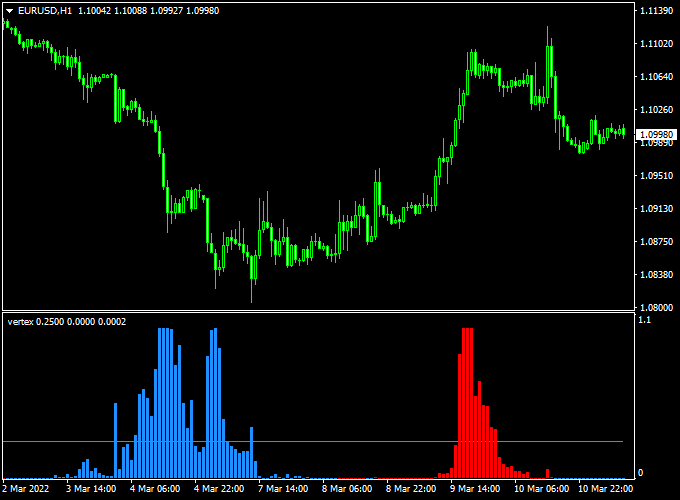
The chart illustrates the Vertex indicator for MT4 displayed in the bottom window.
You can see the transition between blue and red bars, which correlates with the shifts in the price candles above.
The red bars appear when the momentum turns bullish, while the blue bars signal that the bears are taking over.
Guide to Trade with Vertex Indicator
Buy Rules
- Watch the indicator window for a shift from blue bars to red bars.
- Wait for the first red trend bar to be fully formed and closed.
- Ensure that the price action is not currently stuck in a tight consolidation zone.
- Enter a buy position at the opening of the next candle following the red bar signal.
Sell Rules
- Monitor the indicator window until the red bars disappear and a blue bar appears.
- Confirm that the first blue trend bar has closed to avoid false signals.
- Check if the price is coming off a recent high or resistance level.
- Open a sell trade as soon as the blue signal is confirmed by the indicator.
Stop Loss
- For buy trades, place the stop loss a few pips below the most recent swing low.
- For sell trades, set the stop loss slightly above the local swing high.
- Always maintain a stop loss to protect against sudden market spikes or news events.
Take Profit
- Close the trade when the indicator prints a bar of the opposite color.
- For instance, exit a buy trade as soon as the first blue bar appears.
- You can also use a fixed profit target based on the specific timeframe you are trading.
Vertex Indicator + Moving Average 3 Color MT4 Forex Day Trading Strategy
This day trading strategy combines the Vertex Forex Indicator for MT4 with the Moving Average 3 Color Forex Indicator for MT4.
It is designed for M5, M15, and H1 charts, helping traders identify trend direction and precise entry points for intraday trades.
The Vertex indicator provides early buy or sell signals using red and blue bars on the bottom chart.
The Moving Average 3 Color indicator confirms the overall trend with green (uptrend) or red (downtrend) lines.
How This Strategy Works
The Vertex indicator generates early momentum signals when the first red bar appears for a buy opportunity and the first blue bar appears for a sell opportunity.
The Moving Average 3 Color line filters trades by confirming the trend direction.
Only trades that align with both indicators are executed, improving accuracy and reducing false entries.
Buy Entry Rules
- Confirm the Moving Average 3 Color line is green, indicating an uptrend.
- Wait for the first red bar on the Vertex bottom chart.
- Enter a buy trade at the close of the candle that generated the red bar.
- Set a stop loss below the most recent swing low.
- Take profit based on chart timeframe: 10–20 pips for M5, 20–40 pips for M15, 50–80 pips for H1.
Sell Entry Rules
- Confirm the Moving Average 3 Color line is red, indicating a downtrend.
- Wait for the first blue bar on the Vertex bottom chart.
- Enter a sell trade at the close of the candle that generated the blue bar.
- Set a stop loss above the most recent swing high.
- Take profit based on chart timeframe: 10–20 pips for M5, 20–40 pips for M15, 50–80 pips for H1.
Advantages
- Combines trend confirmation and early signal detection for higher probability trades.
- Works across multiple timeframes: M5, M15, and H1.
- Clear visual signals allow easy identification of trade opportunities.
- Reduces trades against the main trend, improving win rate.
Drawbacks
- Requires active monitoring, especially on shorter timeframes (M5, M15).
- Profit targets can be affected by sudden market spikes or news events.
- Trend reversals can trigger stop losses quickly if the signals are not timed properly.
Case Study 1 – EUR/USD M5 Chart
During the London session, EUR/USD showed a green Moving Average 3 Color line confirming an uptrend.
The first red Vertex bar appeared at 1.1015, signaling a buy.
A trade was entered at 1.1016, with a stop loss at 1.1005 and a take profit at 1.1025.
The trade reached the target in 12 minutes, yielding +9 pips.
Case Study 2 – GBP/JPY H1 Chart
On GBP/JPY, the Moving Average 3 Color line was red, confirming a downtrend.
The first blue Vertex bar appeared at 187.60.
A sell trade was entered at 187.58, stop loss at 187.80, and take profit at 186.80.
The trade closed successfully in 3 hours, capturing +78 pips.
Strategy Tips
- Focus on liquid pairs such as EUR/USD, GBP/USD, USD/JPY, and EUR/JPY for tighter spreads.
- Trade during active sessions for stronger trend movements and clearer signals.
- Adjust stop-loss levels depending on the timeframe and pair volatility.
- Consider using support and resistance levels to refine entry and exit points.
- Limit the number of trades on lower timeframes to avoid overtrading.
- Maintain a trading journal to track results and optimize settings over time.
Download Now
Download the “vertex.mq4” indicator for Metatrader 4
FAQ
What do the different colors of the Vertex bars represent?
The red bars indicate that the market has transitioned into a bullish momentum phase, signaling a buy opportunity.
The blue bars represent a shift into bearish momentum, signaling a sell opportunity.
The first bar of a new color is typically considered the entry trigger.
Is this indicator suitable for scalping on M1 or M5 charts?
The Vertex indicator is quite responsive and can be used for scalping.
However, because lower timeframes contain more market noise, it is often best to confirm the Vertex signals with a higher timeframe trend to improve the win rate.
Can I adjust the sensitivity of the trend bars?
While the indicator is designed to be effective with its default settings, you can often find period settings in the inputs.
Reducing the period will make the bars react faster to price, while increasing it will provide a smoother, more stable trend signal.
Summary
The Vertex indicator for MetaTrader 4 is an excellent tool for traders who want a clear and uncomplicated way to read market trends.
Its red and blue histogram provides a reliable map of price momentum, helping you avoid the confusion of lagging indicators.
The tool is especially valuable for its “first bar” signal logic, which allows traders to enter positions at the earliest possible stage of a trend change.
Pairing Vertex with a volume or volatility filter can further refine the signals for even better results.


