
About the Velocity Waves Forex Indicator
The Velocity Waves indicator for MetaTrader 4 is a sophisticated technical tool that reimagines price action through the lens of momentum and wave theory.
Rather than focusing on simple moving averages or standard oscillators, this indicator transforms price data into distinct velocity zones.
It identifies the underlying strength of a move and represents it as color-coded blocks on the chart.
This approach allows traders to see past the noise of individual candles and focus on the collective force driving the market.
By analyzing the speed and magnitude of price changes, the Velocity Waves indicator categorizes market behavior into bullish and bearish phases.
The tool is highly versatile, serving as a primary signal generator for entries or as a secondary filter to ensure you are trading on the side of the prevailing momentum.
Free Download
Download the “VelocityWaves.mq4” indicator for MT4
Key Features
- The indicator converts complex price action into readable velocity waves.
- It uses a color-coded system with red and blue rectangles to define the trend.
- The tool adapts to various market conditions, including high-volatility breakouts.
- It functions as an all-in-one trend confirmation and trade entry system.
Indicator Chart
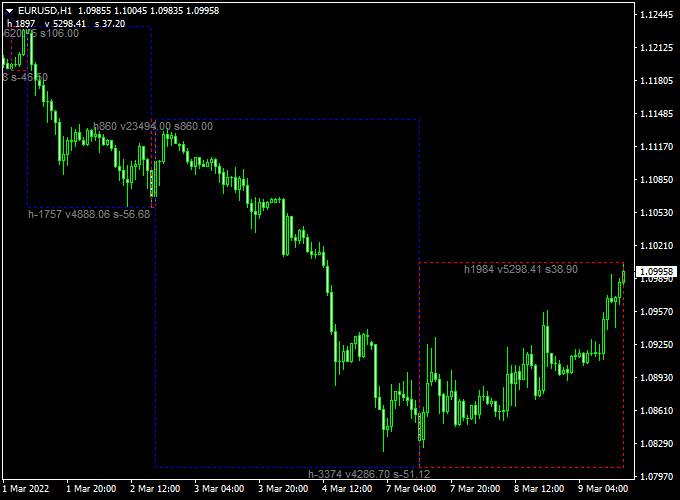
The chart displays the Velocity Waves indicator for MT4 applied directly to the price action.
You will notice red rectangles appearing during phases of bullish strength and blue rectangles forming when the market turns bearish.
Guide to Trade with the Velocity Waves Indicator
Buy Rules
- Monitor the chart for the formation of a red rectangle.
- The appearance of the red color indicates that bullish velocity is increasing.
- Enter a buy position once the red wave is confirmed on the current timeframe.
- Check that the price is maintaining its position above the start of the wave.
Sell Rules
- Watch for the indicator to plot a blue rectangle on the trading window.
- The blue wave confirms that bearish price action is dominating the session.
- Open a sell trade at the close of the candle where the blue wave first appears.
- Ensure there are no major support levels immediately below the entry point.
Stop Loss
- For buy entries, place the stop loss just below the lower boundary of the red rectangle.
- For sell entries, set the stop loss slightly above the upper edge of the blue rectangle.
- This placement ensures you are protected if the wave velocity fails to hold its direction.
Take Profit
- Consider taking profit when the current color block disappears or changes.
- You can exit the trade when the price closes outside of the wave boundary.
- Alternatively, use a trailing stop to follow the wave as it moves in your favor.
Velocity Waves + Hull Moving Average Signal Arrows MT4 Day Trading Strategy
This Forex day trading strategy combines the Velocity Waves Forex Indicator for MT4 with the Hull Moving Average Signal Arrows Indicator for MT4.
It is designed for intraday trading on M15 and M30 charts, providing traders with a clear view of market trends and precise entry signals.
The Velocity Waves indicator transforms the chart into trend zones using blue and red boxes, while the Hull MA arrows pinpoint short-term buy and sell opportunities in the direction of the trend.
How This Strategy Works
The Velocity Waves indicator analyzes price action and highlights the overall trend: red boxes indicate an uptrend and blue boxes indicate a downtrend.
The Hull MA arrows generate buy (blue) and sell (magenta) signals within those trend zones.
Trades are taken only when both indicators align, increasing the probability of successful intraday moves while filtering out counter-trend signals.
Buy Entry Rules
- Wait for a red Velocity Waves box, indicating an overall uptrend.
- Confirm that a blue Hull MA arrow appears within the red box.
- Enter a buy trade at the close of the candle that generated the blue arrow.
- Set a stop loss below the most recent swing low.
- Take profit at 20–40 pips or exit when a blue Velocity Waves box appears or the Hull MA shows a magenta arrow.
Sell Entry Rules
- Wait for a blue Velocity Waves box, indicating an overall downtrend.
- Confirm that a magenta Hull MA arrow appears within the blue box.
- Enter a sell trade at the close of the candle that generated the magenta arrow.
- Set a stop loss above the most recent swing high.
- Take profit at 20–40 pips or exit when a red Velocity Waves box appears or the Hull MA shows a blue arrow.
Advantages
- Provides clear trend visualization to reduce trading against the market.
- Combining trend boxes with arrow signals improves entry accuracy.
- Works well on multiple major and liquid currency pairs.
- Short-term trades reduce exposure to overnight risk.
- Easy to follow visually for intraday traders.
Drawbacks
- Profit targets are relatively small, requiring multiple trades to accumulate significant gains.
- May lag slightly during extremely fast-moving trends, causing late entries.
Case Study 1 – EUR/USD M15 Chart
During the London session, EUR/USD displayed a red Velocity Waves box at 1.1010, indicating an uptrend.
A blue Hull MA arrow appeared at 1.1012.
A buy trade was entered at 1.1013 with a stop loss at 1.1000 and a take profit at 1.1040.
Price reached the target within the session for +27 pips.
Case Study 2 – GBP/JPY M30 Chart
On GBP/JPY, a blue Velocity Waves box appeared at 186.50, indicating a downtrend.
A magenta Hull MA arrow signaled a sell at 186.48.
The trade was executed with a stop loss at 186.70 and a take profit at 186.10.
Price reached the target in 50 minutes, capturing +38 pips.
Strategy Tips
- Focus on major and liquid pairs like EUR/USD, GBP/USD, and USD/JPY for tighter spreads and reliable signals.
- Adjust stop-loss distance based on the volatility of the pair to avoid early stop-outs.
- Consider exiting early if a new trend box appears against your position, even if the take profit has not been reached.
- Use a proper risk management plan and limit the number of trades to avoid overtrading in fast-moving markets.
- Keep a trading journal to track outcomes, refine your strategy, and improve performance over time.
Download Now
Download the “VelocityWaves.mq4” indicator for Metatrader 4
FAQ
What is the difference between the red and blue rectangles?
The red rectangle represents bullish velocity, signaling that buyers are pushing price with significant speed.
The blue rectangle represents bearish velocity, indicating that the sellers have taken control and are driving the price lower.
Is the Velocity Waves indicator better for scalping or swing trading?
It is effective for both, though its wave-based logic is particularly strong for swing traders who want to capture larger moves.
On higher timeframes like the H1 or H4, the waves tend to be more stable and can help you ride a trend for hundreds of pips.
Can I use other indicators alongside Velocity Waves?
Yes, it is common to pair this tool with a volume indicator or a standard RSI.
Using Velocity Waves to confirm the trend direction while using an oscillator for the exact entry timing can create a very reliable trading system.
Summary
The Velocity Waves indicator for MetaTrader 4 offers a modern way to visualize market momentum.
By turning price action into waves of velocity, it takes the complexity out of trend identification.
The use of red and blue rectangles provides a straightforward method for determining whether to be long or short.
It is an excellent choice for traders who want to avoid the “choppiness” of traditional line-based indicators.


