About the Scalper X2 Forex Indicator
Scalper X2 is a Forex indicator for Metatrader 4 that identifies buy and sell trade opportunities throughout the various trading sessions.
Whether you are trading the London open or the New York afternoon, it adapts to current volatility to find consistent entries.
One of its most important features is that Scalper X2 works for any time frame of your preference and does not repaint its signals.
This means once an arrow appears, it stays there, allowing you to build a reliable and consistent trading routine.
The signals appear on the main MT4 chart window in the form of green and red colored signal arrows, making it easy to see exactly when to take action.
Free Download
Download the “Scalper X2.ex4” indicator for MT4
Key Features
- It delivers instant entry and exit signals through colored arrows on the main price chart.
- The non-repainting algorithm ensures that historical signals match real-time performance.
- It helps filter out market noise by only triggering signals during confirmed momentum shifts.
Indicator Chart
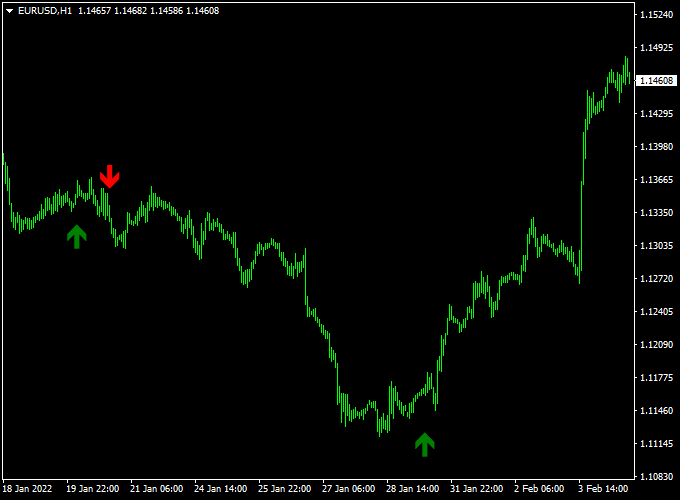
The Scalper X2 indicator chart displays price action with distinct triggers placed above or below the candles.
A green arrow indicates a bullish shift in momentum, while a red arrow points to a bearish move.
Since the arrows are placed directly on the candles, you can easily verify them against your existing support and resistance levels.

Guide to Trade with the Scalper X2 Forex Indicator
To achieve the best results with this tool, follow these specific trading rules.
Buy Rules
- Monitor the chart for a change in sentiment from bearish to bullish.
- Open a buy position when the green arrow gets printed on the chart.
- Wait for the current candle to close to ensure the signal is fully locked in.
- Ensure the price is not currently trading directly into a major resistance zone.
Sell Rules
- Watch for a transition where the buying pressure begins to fade.
- Open a sell position when the red arrow gets printed on the chart.
- Verify the signal by confirming the close of the candle where the arrow appeared.
- Check that there is sufficient room for the price to drop toward the next support level.
Stop Loss
- For buy trades, place the stop loss a few pips below the recent swing low.
- For sell trades, place the stop loss a few pips above the recent swing high.
Take Profit
- Close the open trade when an opposite signal arrow gets displayed on the chart.
- Alternatively, target a fixed risk-to-reward ratio like 1:2 for consistent growth.
- You can also exit the position when the price reaches a major horizontal level.
Scalper X2 + Forex Trend Filter MT4 Scalping Strategy
This MT4 scalping strategy combines the Scalper X2 Forex Indicator with the Forex Trend Filter Indicator.
It is tailored for short-term, high-frequency trading across major pairs such as EUR/USD, GBP/USD, AUD/USD, and USD/CHF.
The idea is to enter quickly when a clear arrow signal appears and only when the histogram trend filter confirms the direction.
Because we’re scalping, we use small profit targets and tight risk controls.
The Scalper X2 shows a green arrow for a buy signal and a red arrow for a sell signal.
The Forex Trend Filter displays a histogram: blue bars indicate a bullish trend, red bars indicate a bearish trend.
By trading only when both signals align, we aim to reduce false entries and increase the probability of success.
Buy Entry Rules
- Wait for a green arrow from the Scalper X2 indicator to appear on the chart.
- Confirm that the histogram of the Forex Trend Filter is blue, indicating a buy trend.
- Enter a buy position immediately after the arrow appears and the histogram is blue.
- Place a stop loss a few pips below the recent swing low or below the arrow candle low.
- Set a take profit target of around 10-20 pips on timeframes like M1 or M5, or 20-30 pips on M15.
- Exit early if the histogram turns red, indicating the trend may be reversing.
Sell Entry Rules
- Wait for a red arrow from the Scalper X2 indicator to appear on the chart.
- Confirm that the histogram of the Forex Trend Filter is red, indicating a sell trend.
- Enter a sell position immediately after the arrow appears and the histogram is red.
- Place a stop loss a few pips above the recent swing high or above the arrow candle high.
- Set a take profit target of around 10-20 pips on M1 or M5, or 20-30 pips on M15.
- Exit early if the histogram turns blue, signaling the trend may reverse.
Advantages
- Simple visual cues: an arrow plus a color histogram make signal identification fast.
- Designed for scalpers: many trades possible with small targets and tight stops.
- Combining arrow signals with trend-filter reduces noise and false signals.
- Works across several major currency pairs, giving diversification of setups.
- Good for active traders who prefer high activity and frequent entries.
Drawbacks
- High frequency means higher transaction cost relative to each trade, especially on wider-spread pairs.
- In very quiet or ranging markets, the histogram may flip often, and arrows may generate many false entries.
- Scalping demands constant focus and fast execution; it may be stressful for casual traders.
Example Case Study 1: GBP/USD M5 Chart
During the New York session, GBP/USD printed a green arrow from Scalper X2 at 1.2850.
At the same moment, the Forex Trend Filter histogram turned blue.
A buy entry was taken at 1.2852, stop loss placed at 1.2837 (15 pips risk), take profit target set at 1.2872 (20 pips).
The trade hit the target within 30 minutes.
Example Case Study 2: USD/CHF M1 Chart
On the USD/CHF pair one afternoon, a red arrow appeared at 0.9245 signaling a sell setup.
The histogram was red on the Forex Trend Filter at the same time.
A sell trade was opened at 0.9244, stop loss at 0.9260 (16 pips), take profit at 0.9224 (20 pips).
Within 12 minutes, the target was reached. The strategy captured a fast move with minimal drawdown.
Strategy Tips
- Focus on high‐liquidity currency pairs like EUR/USD, GBP/USD, AUD/USD, and USD/CHF for tighter spreads and less slippage.
- Use the strategy during active market sessions (London or New York) when volatility is higher.
- If the histogram is flat or changing color frequently, skip the trade—this signals a choppy market.
- Keep risk per trade small (e.g., 0.5-1% of account) because scalping has many trades and each risk builds up.
Download Now
Download the “Scalper X2.ex4” indicator for Metatrader 4
FAQ
What does non-repainting mean for this specific indicator?
In the context of the Scalper X2, non-repainting means that once a signal arrow is printed on the close of a candle, it will never disappear or move to a different candle.
This is critical for traders because it allows for accurate backtesting.
You can look back at your charts and see exactly how the indicator performed without worrying that losing signals were hidden by the code.
Can I use this indicator during high-impact news?
While the indicator will still provide signals during news, the volatility can lead to wide spreads and slippage.
It is usually best to use the Scalper X2 signals during steady trending periods in the London and New York sessions.
If you do trade during news, ensure you are using a wider stop loss to account for the increased price fluctuations.
Does Scalper X2 work on crypto or stock indices?
Yes, the algorithm is based on price action and momentum, which applies to any liquid market.
You can use it on Bitcoin, the US30, or the DAX just as effectively as on currency pairs like EUR/USD.
The logic remains the same: the indicator identifies when one side of the market is losing control and the other is taking over.
Summary
The Scalper X2 for MT4 is an effective momentum tool that assists in determining the appropriate timing for market entries.
By offering a simplified way to view trend changes, it helps you stay focused on your plan rather than second-guessing every move.
This tool helps traders maintain a disciplined routine by highlighting levels where the market is statistically likely to shift.
Using this indicator allows you to filter high-risk trades and focus on high-conviction momentum bursts.


