About the Advanced RSI MTF Forex Indicator
The Advanced RSI MTF Forex Indicator for MT4 is a practical solution for traders who recognize that the most powerful market moves happen when multiple timeframes align.
Most standard oscillators only show you what is happening on the chart you are currently looking at, but this system allows you to pull data from any period.
The Advanced RSI MTF indicator for Metatrader 4 draws overbought and oversold RSI market levels on all your favorite time frames and currency pairs.
MTF stands for multiple time frames, which is a core concept in professional institutional trading.
For example, you can add the RSI chart generated by the 1-hour time frame to the 5-minute chart.
Simply edit the indicator inputs to switch the time frame you want to see.
This helps you avoid trading against the primary trend and ensures you are only entering when the larger momentum is in your favor.
Free Download
Download the “rsi_mtf.mq4” indicator for MT4
Key Features
- It tracks the Relative Strength Index values from any selected timeframe while staying on your execution chart.
- The indicator utilizes a smoothed algorithm to filter out minor price noise and highlight significant momentum.
- It features an adjustable input system that allows for quick switching between different time horizons.
- It identifies deep overbought and oversold conditions that are often invisible on a single-timeframe chart.
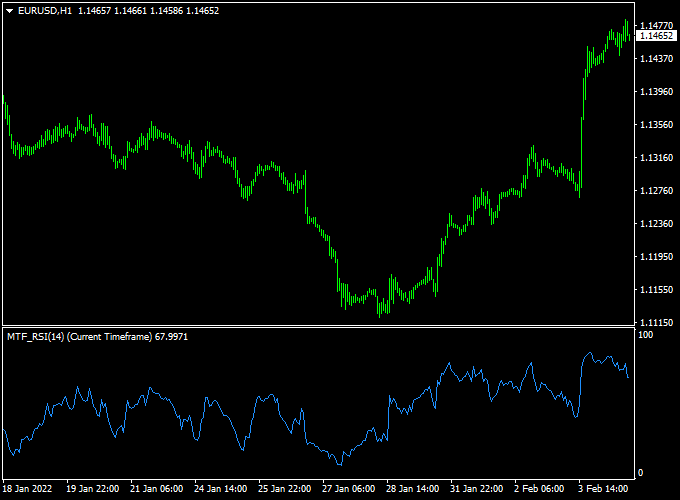
Indicator Chart
The Advanced RSI MTF Forex Indicator chart displays an oscillator line in a separate window below the price bars.
Unlike a standard RSI, this line represents the momentum of a higher timeframe, such as the 4-hour or Daily trend, overlaid on your current view.
When the line hits the extreme boundaries of 0 or 100, it marks a significant point of exhaustion.
This setup allows for a quick assessment of the current market environment without complex manual calculations.

Guide to Trade with Advanced RSI MTF Forex Indicator
To achieve the best results with this tool, follow these specific trading rules.
Buy Rules
- Set the indicator to a higher timeframe than your current chart to find the primary trend.
- Open a buy trade when the indicator reading is 0 (oversold) and the market is trending up.
- Verify the entry with a bullish reversal candlestick pattern on your execution chart.
- Ensure price is sitting at a key horizontal support zone for maximum probability.
Sell Rules
- Monitor the higher timeframe RSI reading for signs of extreme buyer exhaustion.
- Open a sell trade when the indicator reading is 100 (overbought) and the market is trending down.
- Wait for a bearish candle to close as confirmation before clicking the sell button.
- Check that there is sufficient room for price to move lower before reaching the next support.
Stop Loss
- For buy trades, place the stop loss a few pips below the most recent swing low.
- For sell trades, place the stop loss a few pips above the most recent swing high.
- Always keep a strict risk-to-reward ratio to ensure long-term account growth.
Take Profit
- Exit the trade when the RSI line reaches the opposite extreme boundary.
- Alternatively, target the nearest major level of support or resistance on the higher timeframe.
- You can also close half the position at a 1:1 ratio to secure profits early.
Advanced RSI MTF + Zero Lag Moving Average MT4 Scalping Strategy
This MT4 scalping strategy combines two highly accurate tools: the Advanced RSI MTF Forex Indicator and the Zero Lag Moving Average Indicator.
It is designed for traders who prefer fast-paced intraday or short-term scalping setups on timeframes from M1 to M15.
The strategy blends momentum and trend confirmation to identify precise market turning points with minimal delay.
The Advanced RSI MTF shows multi-timeframe relative strength readings and helps identify oversold or overbought zones in real time.
When combined with the Zero Lag Moving Average, which smooths out price noise while maintaining quick response, traders can catch early entries in both trending and ranging markets.
The setup works best in liquid pairs such as EURUSD, GBPUSD, or USDJPY during active London or New York sessions.
Why This Strategy Works
Traditional RSI indicators tend to lag when market momentum shifts rapidly.
By using the Advanced RSI MTF, you can track RSI values from higher timeframes without switching charts.
The Zero Lag Moving Average further refines the entries by filtering out false spikes and aligning trades with the actual price trend.
Together, they create a clear structure for momentum confirmation and low-latency trend identification — essential for scalpers seeking quick and accurate setups.
Buy Entry Rules
- Open a buy trade when the RSI reading on the Advanced RSI MTF is near 0, showing the market is oversold and ready to reverse upward.
- Confirm that the price is trading above the red Zero Lag Moving Average line, indicating a bullish short-term trend.
- Place your stop loss just below the recent swing low or 10 pips below the Zero Lag MA line.
- Set your take profit target at 15–25 pips for scalping, or close the position when the RSI approaches the 70–80 level.
Sell Entry Rules
- Open a sell trade when the RSI reading on the Advanced RSI MTF is near 100, showing the market is overbought and may turn downward.
- Confirm that the price is trading below the red Zero Lag Moving Average line, indicating a bearish trend.
- Place your stop loss just above the recent swing high or 10 pips above the Zero Lag MA line.
- Take profit around 15–25 pips or when the RSI drops back near the 30 level.
Advantages
- Quick reaction to momentum changes thanks to the zero-lag filter.
- Multi-timeframe RSI confirmation increases accuracy and confidence.
- Suitable for both beginner and advanced traders.
- Simple to apply to any major currency pair.
Drawbacks
- Not suitable for low-volatility periods or quiet market hours.
- Frequent signals may appear in sideways markets, requiring discipline.
- Requires quick decision-making — ideal for experienced scalpers.
Example Case Study 1: EURUSD M5 Chart
During the London open, EURUSD dropped sharply before forming an RSI reading of 0 on the Advanced RSI MTF.
The Zero Lag Moving Average turned flat, and price began crossing above it, confirming early bullish momentum.
A buy trade was placed at 1.0830 with a stop loss at 1.0820 and a target at 1.0855.
Within 40 minutes, the trade closed with a +25 pips profit.
This quick reaction to the oversold zone, combined with the Zero Lag MA confirmation, helped identify the reversal early, before most traders joined.
Example Case Study 2: GBPUSD M15 Chart
On the GBPUSD pair, the RSI hit 100 while the price stayed below the Zero Lag Moving Average, confirming a bearish continuation setup.
A sell trade was opened at 1.2705 with a stop loss at 1.2720 and a target at 1.2675.
As momentum increased, the market dropped steadily, hitting the take-profit level within the same session.
The move captured around 30 pips with minimal drawdown, showing the power of using RSI exhaustion together with a fast trend filter.
Strategy Tips
- When the price is above the red Zero Lag Moving Average, focus only on buy signals.
- When the price is below the red Zero Lag Moving Average, take only sell signals.
- Avoid trading during major economic news or low volatility sessions.
- For extra precision, confirm entries with a higher timeframe RSI direction.
Download Now
Download the “rsi_mtf.mq4” indicator for Metatrader 4
FAQ
How do I change the timeframe shown in the oscillator window?
You can change the timeframe by going into the indicator settings and locating the timeframe input field.
Simply type in the desired period, such as 60 for the 1-hour chart or 240 for the 4-hour chart.
This will cause the indicator to recalculate and show the momentum data from that specific period regardless of which chart you are viewing.
Can I use multiple instances of this indicator on one chart?
Yes, you can add the Advanced RSI MTF multiple times to a single chart to see several timeframes at once.
Many professionals use this to see if both the 1-hour and 4-hour RSI are oversold simultaneously.
When these different periods agree, the resulting trade signal is often much stronger and more reliable than a single-frame signal.
What does an indicator reading of 0 or 100 actually signify?
A reading of 0 indicates that the market is extremely oversold on the chosen timeframe, meaning the sellers have likely pushed the price as far as they can for now.
A reading of 100 signifies the opposite, where buyers are exhausted.
These are the primary zones where a trend reversal or a deep correction is most likely to happen.
Summary
The Advanced RSI MTF for MT4 is an effective momentum tool that assists in determining the appropriate timing for market entries.
By allowing you to monitor higher-timeframe energy from a lower-timeframe chart, it provides a unique perspective on trend stability.
This tool helps traders maintain a disciplined routine by highlighting levels where the market is statistically likely to reverse.
Using this indicator allows you to filter high-risk trades that occur when the primary trend is against you.


