About the RSI Monitor Forex Indicator
The RSI Monitor Forex Indicator for MT4 is a practical dashboard that takes the hard work out of multi-timeframe analysis.
Instead of opening nine different windows to check for exhaustion, this tool puts everything you need in one corner of your main chart.
RSI Monitor is a free Metatrader 4 indicator that monitors the overbought/oversold RSI values for 9 different time frames.
It works like an early-warning system, telling you exactly when a pair has reached an extreme price level on anything from a 1-minute to a monthly chart.
This is a massive advantage for traders who want to ensure they aren’t buying into a “top” on a higher timeframe.
Free Download
Download the “RSI_Monitor.mq4” indicator for MT4
Key Features
- It tracks RSI values for 9 different timeframes simultaneously on a single screen.
- The indicator will draw a small bullet whenever the RSI values are either oversold or overbought.
- It features a compact dashboard design that doesn’t clutter your main price action area.
- The system helps traders find “confluence,” where multiple timeframes show the same signal.
- It works perfectly for any asset available in MT4, including forex, gold, and oil.
Indicator Chart
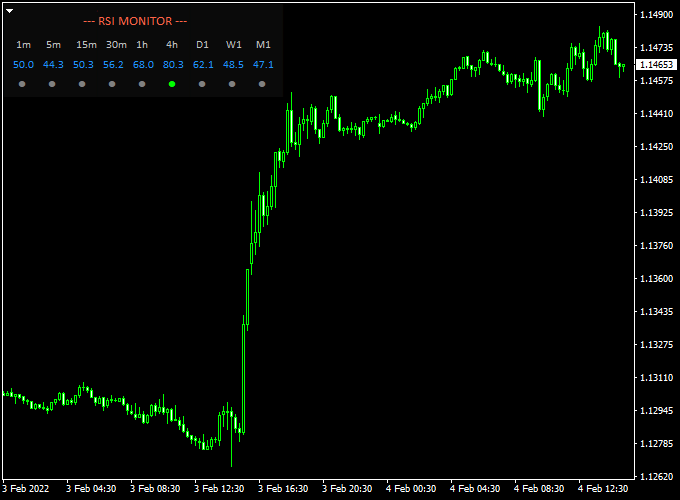
The RSI Monitor Forex Indicator chart features a small table located in one of the corners of your MT4 workspace.
This table lists various timeframes (M1 through MN) and displays the current RSI status for each.
When a timeframe hits an extreme level, a colored bullet or alert appears to grab your attention.
You can keep your main chart clean for price action while the monitor handles the background momentum checks.

Guide to Trade with RSI Monitor Forex Indicator
To achieve the best results with this tool, follow these specific trading rules.
Buy Rules
- Check the monitor for a signal indicating an oversold condition (typically below 30).
- Go long when the RSI value is oversold and the market is trending upwards on the main chart.
- Ensure the lower timeframes are starting to show a recovery “bullet” signal.
- Confirm the entry with a bullish price action pattern like a pin bar or engulfing candle.
Sell Rules
- Look for the monitor to highlight an overbought condition (typically above 70).
- Go short when the RSI value is overbought and the market is trending downwards.
- Wait for a reversal signal on your execution timeframe to time the entry.
- Verify that the price is hitting a major resistance zone on the higher timeframes.
Stop Loss
- For buy trades, place the stop loss 2-3 pips below the most recent support or swing low.
- For sell trades, place the stop loss 2-3 pips above the most recent resistance or swing high.
- Always protect your account by keeping your risk-per-trade at a manageable level.
Take Profit
- Exit the trade when the RSI monitor shows the opposite extreme on your trading timeframe.
- Alternatively, use a fixed target based on the previous market structure.
- You can also close the trade when the “bullet” signal disappears, indicating momentum has cooled.
RSI Monitor + Trend Predictor V1.0 Forex Day Trading Strategy
This MT4 day trading strategy combines two effective tools — the RSI Monitor Forex Indicator and the Trend Predictor V1.0 Forex Indicator.
Together, they help traders identify intraday opportunities by merging strength analysis with visual trend confirmation.
The RSI Monitor displays live RSI values across multiple timeframes, allowing traders to spot when markets are overbought or oversold.
The Trend Predictor V1.0 adds clarity by plotting blue and red arrows directly on the chart to signal trend direction changes.
This setup is well-suited for day traders who prefer clean, fast, and reliable signals.
It performs best on the M15 to H1 charts, where intraday price swings offer frequent setups without excessive noise.
By combining momentum data with directional arrows, traders can align entries with high-probability market reversals and trend continuations.
Buy Entry Rules
- Check the RSI Monitor dashboard for RSI values below 30, showing an oversold condition.
- Wait for the Trend Predictor V1.0 to print a blue arrow on your chart.
- Confirm the general trend is bullish or recovering from a recent dip.
- Enter a buy trade once both indicators align.
- Set a stop loss 20–25 pips below the latest swing low.
- Target 40–60 pips or exit when a red arrow appears.
Sell Entry Rules
- Look at the RSI Monitor and confirm RSI values are above 70, signaling an overbought condition.
- Wait for the Trend Predictor V1.0 to show a red arrow on the chart.
- Ensure the market is in a bearish phase or forming a lower high.
- Enter a sell trade when both conditions occur together.
- Place a stop loss 20–25 pips above the last swing high.
- Take profit after 40–60 pips or when a blue arrow appears.
Advantages
- Combines strength analysis and visual trend confirmation for high-accuracy trades.
- RSI Monitor helps filter weak setups by showing multiple time frame alignment.
- Arrows from Trend Predictor make decision-making simple and quick.
- Ideal for day traders seeking 1–3 solid setups per session.
- Helps avoid emotional entries by focusing on clear dashboard signals.
Drawbacks
- Can miss early entries if the RSI condition and arrow confirmation occur with a delay.
- Performance drops in ranging markets where price frequently whipsaws.
- Arrows may appear late during high volatility or during major news events.
- Requires monitoring several pairs and timeframes, which can be demanding for beginners.
- Not suitable for long-term trading since signals are short-lived and designed for day setups.
Example Case Study 1
On the EUR/USD M30 chart during the London session, RSI readings on the Monitor dashboard dropped below 25, signaling heavy oversold conditions.
Shortly afterward, the Trend Predictor V1.0 displayed a blue arrow at 1.0730.
A buy trade at 1.0732 with a 25-pip stop loss was opened.
The price climbed steadily to 1.0788 within two hours, producing a gain of 56 pips before a red arrow appeared, signaling exit.
Example Case Study 2
On GBP/USD H1, the RSI Monitor showed RSI values above 75 across several timeframes, suggesting an overbought scenario.
The Trend Predictor then printed a red arrow at 1.2835.
A sell entry at 1.2832 with a 25-pip stop loss was placed.
The price dropped to 1.2780 before stabilizing, yielding 52 pips in profit as RSI values normalized near 50, indicating the end of the downward move.
Strategy Tips
- Use this method during active sessions like London or New York for stronger price action.
- Focus on major pairs such as EUR/USD, GBP/USD, and USD/JPY for consistent liquidity.
- Wait for both signals — RSI condition first, then arrow confirmation — before entering.
- Avoid overlapping trades across correlated pairs to reduce exposure.
- Secure partial profits once the trade moves 30 pips in your favor.
- Stay out of the market during major news announcements that can distort RSI readings.
Download Now
Download the “RSI_Monitor.mq4” indicator for Metatrader 4
FAQ
Why is multi-timeframe monitoring important?
Trading in only one timeframe is like looking through a keyhole. Multi-timeframe monitoring allows you to see the “big picture.”
If the 5-minute chart looks like a buy, but the 4-hour chart is heavily overbought, the trade is much riskier.
The RSI Monitor helps you avoid these traps by showing you the status of all timeframes at once.
Does the indicator send mobile alerts?
Depending on your MT4 settings, you can configure the RSI Monitor to send notifications to your smartphone or email.
This is incredibly helpful for traders who cannot sit in front of the computer all day but want to be alerted when a high-probability reversal is setting up.
What do the “bullets” represent?
The bullets are visual triggers. They appear when the RSI calculation for that specific timeframe crosses into the extreme zones (usually above 70 or below 30).
They stay visible as long as the market remains in that extreme state, acting as a constant reminder of potential exhaustion.
Summary
The RSI Monitor for mt4 is an effective technical tool that helps traders stay on the right side of market momentum across the board.
It offers a clear visual representation of when a trend is gaining strength or starting to fade on multiple horizons.
This indicator assists in maintaining a professional edge by identifying high-probability entry points that signal trend transitions.
Using it consistently helps in building a more disciplined approach to entries and exits.


