About the RSI Chart Bars Forex Trend Indicator
The RSI Chart Bars Forex Trend Indicator for MT4 is a practical tool that takes the guesswork out of reading market momentum.
Instead of trying to interpret a squiggly line in a separate window, this indicator changes the color of the price bars to tell you exactly who is in control.
When the market has strong upward energy, the bars turn blue; when the sellers take over, they turn red.
It uses the reliable RSI formula but applies it directly to the candles, helping you stay in winning trades longer without getting distracted by minor price wiggles.
Because the signals are non-repainting, you can trust the colors as soon as a candle closes, making it a straightforward choice for anyone who wants a cleaner, more efficient trading screen.
Free Download
Download the “rsi chart bars.mq4” indicator for MT4
Key Features
- The indicator pops up in the main chart as blue/red colored candlesticks for intuitive trend tracking.
- It features a non-repainting algorithm, meaning the color of the bars remains fixed once the candle closes.
- The tool delivers excellent signals for good ROI by filtering out market noise during sideways phases.
- It integrates momentum data into the candlesticks to provide a cleaner trading interface.
Indicator Chart
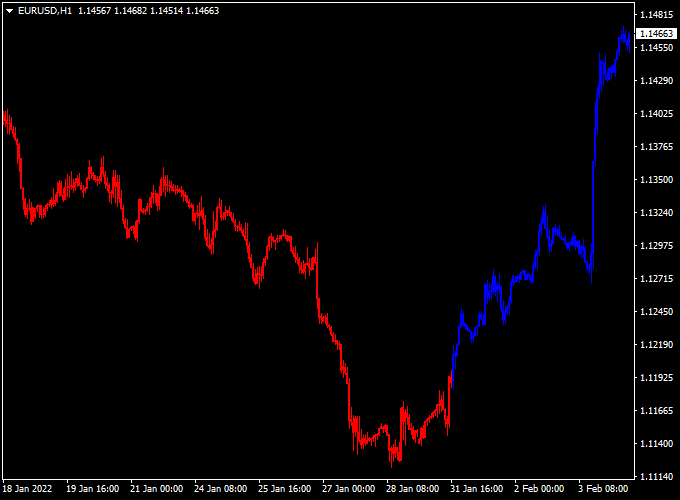
The RSI Chart Bars Forex Trend Indicator chart displays price candles that shift color based on the current trend direction.
Blue candlesticks represent a bullish environment, suggesting that buying pressure is in control.
Red candlesticks indicate a bearish trend where sellers are dominating the price action.

Guide to Trade with RSI Chart Bars Forex Trend Indicator
To achieve the best results with this tool, follow these specific trading rules.
Buy Rules
- Monitor the chart for the transition from a red bearish sequence to blue.
- Buy the currency pair when the first blue candlestick gets painted on the chart.
- Wait for the candle to close to ensure the signal is fully confirmed.
- Check that the price is not trading directly into a major resistance level.
Sell Rules
- Observe the price bars for a shift from blue bullish candles to red.
- Sell the currency pair when the first red candlestick gets painted on the chart.
- Ensure the candle has closed to verify the momentum change.
- Confirm that there is enough room for the price to drop before hitting a support zone.
Stop Loss
- For buy trades, place the stop loss a few pips below the low of the signal candle.
- For sell trades, place the stop loss a few pips above the high of the signal candle.
- Always keep your risk fixed per trade to protect your capital.
Take Profit
- Exit the trade as soon as the first candle of the opposite color is painted.
- Alternatively, target a specific risk-to-reward ratio like 1:2 or 1:3.
- You can also use a trailing stop behind the colored bars to capture larger moves.
RSI Chart Bars + Major Trend Forex Signal Strategy
This strategy combines the RSI Chart Bars Forex Trend Indicator MT4 with the Major Trend Forex Signals Indicator MT4.
It is designed for day traders seeking early entries in the direction of the major trend while confirming momentum with candlestick signals.
This strategy works best on 15-minute to 1-hour charts and is suitable for major currency pairs as well as active minors.
How It Works
The RSI Chart Bars indicator paints colored candlesticks: blue for a buy opportunity and red for a sell opportunity.
The Major Trend Forex Signals indicator displays the overall trend: “Major Trend: Up” for bullish markets and “Major Trend: Down” for bearish markets.
By waiting for the first candlestick signal to appear in the same direction as the major trend, traders can enter trades aligned with both momentum and trend direction.
This combination filters false signals and increases the likelihood of capturing meaningful intraday moves.
Buy Entry Rules
- The first blue candlestick appears on the RSI Chart Bars indicator.
- The Major Trend indicator displays “Major Trend: Up,” confirming a bullish trend.
- Enter a buy trade at the opening of the next candle after both conditions are met.
- Stop loss is placed a few pips below the recent swing low or below the first blue candlestick.
- Take profit at the next local resistance, or use a trailing stop that follows the last two lows of the trend until the trend reverses.
Sell Entry Rules
- The first red candlestick appears on the RSI Chart Bars indicator.
- The Major Trend indicator displays “Major Trend: Down,” confirming a bearish trend.
- Enter a sell trade at the opening of the next candle after confirmation.
- Stop loss is placed a few pips above the recent swing high or above the first red candlestick.
- Take profit at the next local support, or use a trailing stop that follows the last two highs until the trend reverses.
Advantages
- Combines trend confirmation with momentum-based candlestick signals for higher probability trades.
- Clear visual cues reduce hesitation and make intraday trading straightforward.
- Flexible take-profit options using trailing stops allow capturing extended moves.
- Applicable across multiple currency pairs and timeframes, allowing versatility.
Drawbacks
- The trailing stop method requires attention; not ideal for fully automated trading unless programmed.
- Early candlestick signals may appear just before minor counter-trend corrections.
Case Study 1 – EUR/JPY 30-Minute Chart
The first blue candlestick appeared on the RSI Chart Bars indicator, while the Major Trend indicator displayed “Major Trend: Up.”
A buy trade was entered at 128.50, stop loss at 128.35, and a trailing stop was applied following the two most recent swing lows.
The price moved upward, and the trailing stop closed the trade at 129.20, capturing 70 pips in under 4 hours.
Case Study 2 – GBP/USD 1-Hour Chart
The first red candlestick appeared on the RSI Chart Bars indicator, and the Major Trend indicator displayed “Major Trend: Down.”
A sell trade was opened at 1.3100, stop loss at 1.3120, with a trailing stop following the last two highs.
The trade reached 1.3045 before the trailing stop closed the position, capturing 55 pips.
Strategy Tips
- Always check that the Major Trend indicator matches the candlestick signal before entering a trade.
- Use multiple timeframes to confirm the trend; higher timeframe alignment increases success probability.
- Trailing stops help capture extended trends, but should be adjusted for market volatility and spread.
- Consider combining this strategy with session-specific trading rules (e.g., London open or New York session) for higher intraday momentum.
Download Now
Download the “rsi chart bars.mq4” indicator for Metatrader 4
FAQ
How does this indicator differ from a standard RSI oscillator?
The RSI Chart Bars Forex Trend Indicator simplifies the interpretation by applying the logic directly to the candles.
Instead of looking for specific levels like 70 or 30, the indicator handles the math and changes the bar color.
This leads to faster decision-making and a much cleaner chart layout.
Can I use this for scalping on 5-minute charts?
Yes, this indicator is very effective for scalping when used during the London and New York overlaps.
Because the RSI Chart Bars indicator does not repaint the buy/sell candlesticks, you can rely on the signals in fast-moving environments.
It helps scalpers identify the start of a quick momentum burst.
Is it possible to combine this with a moving average?
Adding a long-term moving average is a professional way to filter these signals.
Only taking blue signals when the price is above the moving average can significantly increase your win rate.
This ensures you are always trading in the direction of the higher-timeframe trend.
Summary
The RSI Chart Bars for mt4 is an effective trend-following tool that assists in determining the appropriate timing for market entries.
By calculating the ratio of upward to downward moves, it offers a quantitative view of price strength.
This tool helps traders maintain a disciplined routine by highlighting levels where the market is statistically likely to move in a new direction.
Using this indicator allows you to filter high-risk trades that occur during periods of low conviction.


