
About the Precise Price Reversal Forex Indicator
The Precise Price Reversal Forex Indicator for MT4 is an advanced technical system that identifies market trends with high accuracy.
It works by analyzing price fluctuations to determine when a trend is starting or ending.
This tool is unique because it uses a proprietary calculation to filter out minor pullbacks, focusing only on significant structural changes in price.
The Precise Price Reversal indicator for mt4 signals high-probability reversal points in the currency market.
By using the Precise Price Reversal Forex Indicator, you can remove the guesswork from identifying market tops and bottoms.
Free Download
Download the “Reversal.mq4” indicator for MT4
Key Features
- The price reversal signals appear as buy/sell arrows in the main MT4 chart for immediate execution.
- It uses advanced volatility filtering to distinguish between a simple retracement and a true trend change.
- The indicator does not repaint, meaning once a signal is confirmed at the candle close, it remains fixed.
- It includes an alert system to notify you of new reversal points without needing to watch the screen constantly.
- The interface is clean and unobtrusive, allowing you to use it alongside your existing chart analysis tools.
- It is optimized for low-latency performance to ensure smooth operation during high-volatility news events.
Indicator Chart
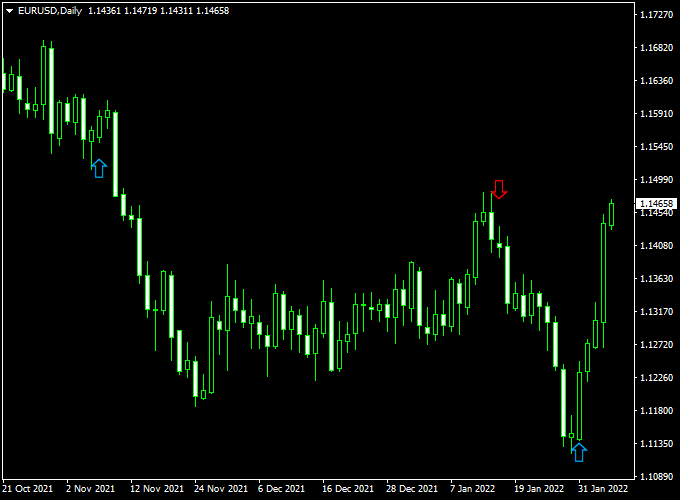
The Precise Price Reversal Forex Indicator chart displays intuitive visual arrows directly on the price candles.
A blue arrow is a trend reversal buy signal, typically appearing at the base of a downward move.
A red arrow is a trend reversal sell signal, surfacing at the peak of an upward rally.
This layout allows for a quick assessment of the current market environment without complex manual calculations.
Guide to Trade with Precise Price Reversal Forex Indicator
To achieve the best results with this tool, follow these specific trading rules.
Buy Rules
- Wait for a blue arrow to appear at the bottom of a price swing.
- Ensure the candle associated with the arrow has fully closed.
- Open a buy position at the opening of the subsequent candle.
- Confirm that the signal is occurring near a known support level for higher conviction.
Sell Rules
- Wait for a red arrow to appear at the top of a price swing.
- Verify that the candle has closed to confirm the signal validity.
- Open a sell position at the start of the next trading session or candle.
- Check that the signal aligns with a resistance zone or a psychological price level.
Stop Loss
- For buy trades, place the stop loss just below the low of the signal candle.
- For sell trades, place the stop loss just above the high of the signal candle.
- Always protect your capital by using a fixed stop loss on every entry.
Take Profit
- Exit the trade when an opposite signal arrow appears on the chart.
- Alternatively, target the next major support or resistance level.
- You can also use a trailing stop to capture a larger portion of the new trend.
Precise Price Reversal + Fibonacci Bands MT4 Day Trading Strategy
This strategy combines the Precise Price Reversal Forex Indicator MT4 with the Fibonacci Bands MT4 Indicator.
It is designed for day traders who want to capture clear trend reversals while trading with the direction of the prevailing trend.
The strategy works best on 15-minute to 1-hour charts and is suitable for both major and minor currency pairs.
How It Works
The Precise Price Reversal indicator generates blue arrows for buy reversals and red arrows for sell reversals.
Fibonacci Bands provide trend confirmation: when the bands slope upwards, the market is bullish; when they slope downwards, the market is bearish.
By combining these two tools, traders enter trades at trend reversal points while confirming the overall trend, improving the probability of successful trades.
Buy Entry Rules
- Fibonacci Bands are sloping upwards, indicating a bullish trend
- The Precise Price Reversal indicator shows a blue arrow
- Enter a buy trade at the candle following the arrow
- Place a stop loss below the nearest swing low or the lower Fibonacci band
- Take profit near the next resistance level or at a 1:2 risk-to-reward ratio
Sell Entry Rules
- Fibonacci Bands are sloping downwards, indicating a bearish trend
- The Precise Price Reversal indicator shows a red arrow
- Enter a sell trade at the candle following the arrow
- Place a stop loss above the nearest swing high or the upper Fibonacci band
- Take profit near the next support level or at a 1:2 risk-to-reward ratio
Advantages
- Combines reversal signals with trend confirmation for higher accuracy
- Visual signals are easy to interpret, reducing indecision
- Works across multiple timeframes, allowing flexible day trading setups
- Clear stop loss and take profit placement using Fibonacci bands
- Applicable to multiple currency pairs and market conditions
Drawbacks
- False reversal signals can occur during choppy or sideways markets
- Requires monitoring of the trend direction for proper confirmation
- Stop loss and take profit levels may need adjustment in highly volatile sessions
- May miss quick price moves if waiting for strict confirmation
Example Case Studies
Case Study 1
On the AUD/USD 30-minute chart, the Fibonacci Bands sloped upwards, indicating a bullish trend.
A blue arrow appeared on the Precise Price Reversal indicator, confirming a buy entry.
The trade was opened at 0.6735, with a stop loss at 0.6715 and a take profit at 0.6795.
The trade captured 60 pips in less than 4 hours, illustrating how reversal signals combined with trend direction can provide strong entry points.
Case Study 2
On the NZD/JPY 1-hour chart, the Fibonacci Bands sloped downwards, showing a bearish trend.
A red arrow appeared on the Precise Price Reversal indicator, signaling a sell.
A trade was opened at 88.45, stop loss placed at 88.85, and take profit set at 87.85.
The trade successfully reached the target within 6 hours, demonstrating the effectiveness of aligning reversal signals with band slope for day trading.
Strategy Tips
- Always confirm trend direction with Fibonacci Bands before taking reversal signals
- Use multiple timeframes to confirm overall market direction and avoid false signals
- Adjust stop loss and take profit based on volatility and pair characteristics
- Be cautious during major economic news events that can disrupt trends
- Maintain a trading log to track trades and refine the strategy over time
Download Now
Download the “Reversal.mq4” indicator for Metatrader 4
FAQ
Does this indicator work better on higher or lower timeframes?
The Precise Price Reversal Forex Indicator is effective on all timeframes, but the signals are more robust on the 1-hour and 4-hour charts.
Higher timeframes naturally filter out more market noise, leading to higher probability reversals.
For scalpers, using it on the 5-minute chart can work well if you only trade during high-volume sessions.
Can I use these arrows to trade binary options?
Yes, many traders use the Precise Price Reversal signals for short-term trades.
Because the indicator identifies high-probability turning points, it can provide the edge needed for timed expirations.
However, it is always recommended to test the signals on a demo account first to understand the timing.
How should I handle signals that appear against a strong trend?
While the indicator is designed to find reversals, the most successful trades often happen when the reversal aligns with a higher-timeframe trend.
If a blue arrow appears during a minor pullback in a larger uptrend, it has a very high success rate.
Professional traders often use a trend filter to choose which arrows to trade.
Summary
The Precise Price Reversal for mt4 is an efficient technical tool that helps traders locate the beginning of new market phases.
It offers a simplified way to view price exhaustion, making it easier to capitalize on market extremes.
This indicator assists in maintaining a professional routine by providing clear, non-repainting entry points.
Using this system allows you to trade with more confidence by removing the ambiguity of manual trend analysis.


