
About the Relative Vigor Index Indicator
The Relative Vigor Index Indicator for MT4 is an advanced momentum oscillator that provides deep insights into the internal strength of a trend.
It works by smoothing price data to show the consistency of market direction over a specific period.
This tool is unique because it uses a dual-line system to confirm shifts in momentum before they become obvious on the price chart.
The Relative Vigor Index (RVI) for Metatrader 4 can be classified as a momentum indicator that measures the strength of the trend.
One of the main benefits of this system is its ability to filter out market noise during low-volatility periods.
Because it focuses on the closing price relative to the daily range, it offers a more nuanced view than traditional oscillators.
RVI is a versatile technical indicator that can be used to identify divergence between price and RVI, as well as to generate a simple crossover signal.
By using the Relative Vigor Index Indicator, you can develop a more objective trading plan.
Free Download
Download the “Relative vigor index.mq4” indicator for MT4
Key Features
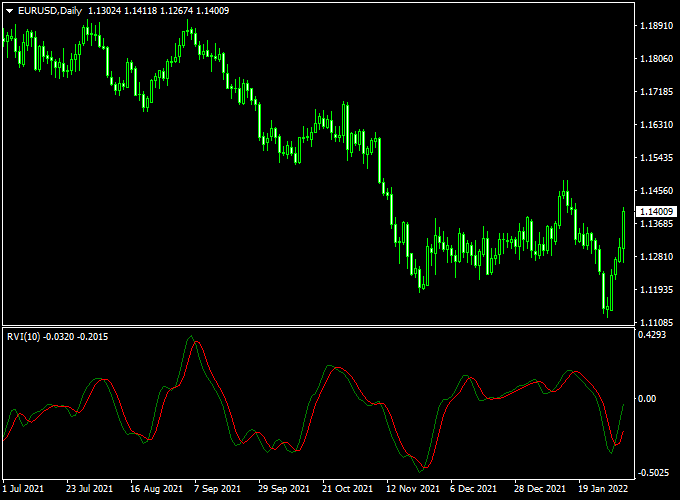
- The indicator displays a separate MT4 chart window, featuring two colored signal lines.
- It identifies trend strength by comparing the closing price to the trading range of each candle.
- The crossover of the two RVI lines acts as a leading indicator for potential market reversals.
- Divergence detection helps traders spot when price action and momentum are no longer in sync.
- The zero-line crossover serves as a confirmation of a broader trend change.
- It is highly compatible with other technical tools like moving averages or Bollinger Bands.
Indicator Chart
The Relative Vigor Index Indicator chart presents two oscillating lines that move around a central zero level.
When the lines are above zero and trending upward, the market shows strong bullish vigor.
If the lines drop below zero, it indicates that the bears have taken control of the momentum.
This separate window layout allows for an immediate assessment of whether the current price movement is backed by genuine volume and strength or if the move is likely to fail.
Guide to Trade with the Relative Vigor Index Indicator
To achieve the best results with this tool, follow these specific trading rules.
Buy Rules
- Wait for the faster RVI line to cross above the slower signal line.
- Open a buy trade when both RVI signal lines cross the 0.00 level bottom-up.
- Ensure that the price has recently formed a support base on the main chart.
- Confirm that the slope of the lines is steep, indicating rising momentum.
Sell Rules
- Wait for the faster RVI line to cross below the slower signal line.
- Open a sell trade when both RVI signal lines cross the 0.00 level top-down.
- Check the main chart to see if price is trading below a recent resistance level.
- Verify that the crossover occurs at a high point in the RVI window for better timing.
Stop Loss
- For buy trades, place the stop loss a few pips below the most recent swing low.
- For sell trades, place the stop loss a few pips above the most recent swing high.
- Always adjust your position size to match your personal risk management profile.
Take Profit
- Exit the trade when the signal lines cross back in the opposite direction.
- Alternatively, close the position if the RVI lines flatten out, suggesting lost vigor.
- You can also use traditional support and resistance levels as primary targets.
RVI + Reversal Stop Signal Forex Scalping Strategy
This day‑trading scalper strategy uses the Relative Vigor Index Indicator MT4 and the Reversal Stop Signal MT4 Indicator.
It’s designed for short intraday trades on fast time‑frames (1‑minute, 5‑minute, or 15‑minute charts) and aims to capture quick moves by aligning momentum and trend‑reversal cues.
How It Works
The RVI measures momentum by comparing closing and opening prices relative to the price range and oscillates around the zero line.
In our version, we open a trade when both RVI signal lines cross the 0.00 level (bottom‑up for buy, top‑down for sell).
The Reversal Stop Signal indicator provides trend bias via coloured bullets and lines: green bullet + green line indicates bullish trend, red bullet + red line indicates bearish trend.
By waiting for trend bias confirmation, then momentum crossing at zero, we improve signal reliability.
Buy Entry Rules
- The Reversal Stop Signal indicator must show a green bullet and a green trend‑line (indicating a bullish trend).
- In the RVI panel, both signal lines cross from below up through the 0.00 level (i.e., both lines move bottom‑up across zero).
- Once both conditions appear, enter a buy trade on the next candle.
- Place a stop loss just below the recent minor swing low or just below the candle that triggered the signal.
- Set take profit at a small fixed pip‑target (e.g., 8‑20 pips) or use a 1:1.5 risk‑to‑reward ratio, whichever occurs first.
Sell Entry Rules
- The Reversal Stop Signal indicator must show a red bullet and a red trend‑line (indicating bearish trend).
- In the RVI panel, both signal lines cross from above down through the 0.00 level (i.e., top‑down across zero).
- Once both conditions appear, enter a sell trade on the next candle.
- Place a stop loss just above the recent minor swing‑high or just above the candle that triggered the signal.
- Set take profit at a small fixed pip‑target (e.g., 8‑20 pips) or use a 1:1.5 risk‑to‑reward ratio, whichever occurs first.
Advantages
- Clear, simple rules: trend bias + zero‑level crossing makes the setup straightforward.
- Fast timeframe scalping allows multiple opportunities during the trading session.
- Combines momentum (via RVI crossing zero) with trend‑confirmation (via Reversal Stop Signal bullets/lines) to reduce false entries.
- Fixed small targets help limit exposure and allow quick exits.
Drawbacks
- Small pip‑targets require tight spread pairs and good execution; latency or slippage can hurt.
- In choppy or non‑trending market conditions, the strategy may generate many false signals (RVI crossing back and forth, bullets/lines flipping).
- Stop‑loss to profit ratio may still be unfavorable if the move doesn’t continue after entry (risk of frequent small losses).
Case Study 1
On the EUR/USD 5‑minute chart, the Reversal Stop Signal indicator shows a green bullet with a green line trending upwards.
At the same moment in the RVI window, both signal lines cross up through the 0.00 level.
A buy trade is taken at 1.1105, stop loss placed at 1.1095 (10 pips risk), and take profit set at 1.1120 (15 pips target = 1.5× risk).
The trade reaches the target within 20 minutes, illustrating how the trend‑confirmed momentum entry can work.
Case Study 2
On the GBP/USD 1‑minute chart during a rapid move, the Reversal Stop Signal turns red (red bullet + red line).
Shortly after, in the RVI, the two lines cross down through the 0.00 level.
A sell trade is entered at 1.2440, stop loss placed at 1.2450 (10 pips risk), and take profit at 1.2425 (15 pips target).
The move completes in under 10 minutes, showing how the setup can capture quick intraday momentum.
Strategy Tips
- Always ensure the trend bias is confirmed via the Reversal Stop Signal before acting on RVI zero‑line crossings.
- Use pairs with low spread and high liquidity (major Forex pairs) when scalping on 1‑5 minute charts.
- If the RVI lines cross but the Reversal Stop Signal hasn’t yet changed color, skip the trade — wait for full confirmation.
- Keep a trading log of all entries, stop losses, take profits, and reasons for each trade to assess performance and refine the strategy.
Download Now
Download the “Relative vigor index.mq4” indicator for Metatrader 4
FAQ
What is the difference between RVI and the Stochastic Oscillator?
While both are oscillators, the Relative Vigor Index Indicator focuses on the relationship between the open and close price relative to the range.
The Stochastic looks at the close relative to the high-low range over time.
The RVI tends to be smoother and is often better at identifying the actual conviction of a trend rather than just overextended levels.
How do I use RVI divergence in my trading?
Divergence occurs when the price makes a new high, but the RVI lines fail to follow.
This suggests that while the price is rising, the actual vigor or energy behind the move is fading.
This is often a professional signal to tighten stop losses or look for a reversal entry.
Which period setting is best for the Relative Vigor Index?
The standard setting is usually 10 periods, which works well for most day trading strategies.
For swing trading on the 4-hour or daily charts, some traders increase the period to 14 to reduce market noise.
Testing different settings helps you find the right balance between sensitivity and reliability.
Summary
The Relative Vigor Index for mt4 is an effective technical tool that helps traders stay on the right side of market momentum.
It offers a clear visual representation of the strength behind price action, making it easier to avoid weak setups.
This indicator assists in maintaining a professional edge by identifying when a trend is gaining energy or starting to tire.
Using it consistently helps in building a more disciplined approach to market entries.


