About the Auto Forex Regression Channel Indicator
The Auto Forex Regression Channel Indicator for MT4 is an advanced technical system that identifies market trends with high accuracy.
It works by analyzing price fluctuations to determine when a trend is starting or ending.
This tool is unique because it utilizes a dynamic channel interface that shifts based on the strength and direction of the current momentum.
The regression channel will dynamically update its slope according to the underlying trend.
This allows traders to avoid false breakouts and stay in winning trades longer.
The indicator is very reliable, lightweight, and will not slow down your trading platform.
Free Download
Download the “regression_channel.mq4” indicator for MT4
Key Features
- It automatically draws regression lines that adjust as new price data enters the market.
- The upper and lower boundaries act as dynamic overbought and oversold levels.
- The central median line provides a target for mean reversion strategies.
- The trend is upward when the indicator slope is rising and downward when it is declining.
- It works for any currency pair, commodity, or index available on the MT4 platform.
Indicator Chart
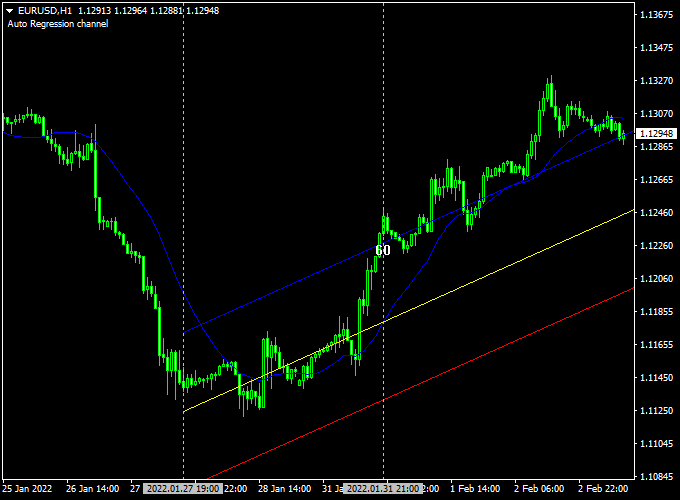
The Auto Forex Regression Channel Indicator chart displays a three-line corridor surrounding the price action.
The outer lines represent the statistical extremes of the current move, while the center line shows the average price path.
When the slope of the entire channel angles upward, it confirms a bullish environment.
Conversely, a downward-sloping channel indicates that the sellers are in control of the market.

Guide to Trade with Auto Forex Regression Channel Indicator
To achieve the best results with this tool, follow these specific trading rules.
Buy Rules
- Wait for the slope of the regression channel to point upward.
- Look for price to touch or penetrate the lower channel boundary.
- Open a buy position when a bullish reversal candle forms at the bottom line.
- Ensure the overall higher timeframe trend is also pointing up.
Sell Rules
- Wait for the slope of the regression channel to point downward.
- Look for price to touch or penetrate the upper channel boundary.
- Open a sell position when a bearish reversal candle forms at the top line.
- Verify that the downward slope is steep enough to confirm momentum.
Stop Loss
- For buy trades, place the stop loss a few pips below the lower boundary line.
- For sell trades, place the stop loss a few pips above the upper boundary line.
- Always maintain a positive risk-to-reward ratio.
Take Profit
- Exit the trade when price reaches the opposite channel boundary.
- Alternatively, close half the position at the center median line.
- You can also set a fixed target based on previous market swing points.
Auto Forex Regression Channel + XMaster Formula MT4 Day Trading Strategy
This strategy combines the Auto Forex Regression Channel Indicator MT4 and the XMaster Formula MT4 Indicator to create a precise day trading approach.
By using trend analysis and reliable signal triggers, traders can identify high-probability entries and exits.
This strategy works on 15-minute to 1-hour charts and is suitable for traders who prefer structured rules and clear visual signals.
How It Works
The Auto Forex Regression Channel helps determine the trend direction and potential reversal zones.
When the slope of the channel is rising, it indicates an upward trend, and when it is declining, it indicates a downward trend.
The XMaster Formula provides entry signals with yellow arrows for buy and sell, helping traders time their entries more accurately.
Combining these indicators allows traders to enter trades in the direction of the trend while avoiding false signals.
Buy Entry Rules
- Trend is upward (Auto Forex Regression Channel slope is rising)
- XMaster Formula shows a yellow UP arrow
- Enter a buy trade at the candle following the arrow
- Place a stop loss below the nearest channel support line
- Take profit at the next channel resistance or a 1:2 risk-to-reward ratio
Sell Entry Rules
- Trend is downward (Auto Forex Regression Channel slope is declining)
- XMaster Formula shows a yellow DOWN arrow
- Enter a sell trade at the candle following the arrow
- Place a stop loss above the nearest channel resistance line
- Take profit at the next channel support or a 1:2 risk-to-reward ratio
Advantages
- Clear trend identification reduces the chance of trading against the market
- Signal arrows help time entries for better accuracy
- Works across multiple time frames for flexible day trading
- Provides visual support and resistance through the regression channel
- Helps manage risk with clearly defined stop loss and take profit levels
Drawbacks
- Can generate false signals in sideways or choppy markets
- Requires patience to wait for both trend and signal confirmation
- Short-term fluctuations may trigger early stop losses
- Traders need to monitor multiple time frames for the best results
Case Study 1
On the EUR/USD 30-minute chart, the Auto Forex Regression Channel showed a rising slope.
A yellow UP arrow appeared from the XMaster Formula, confirming a buy entry.
The trade was opened at 1.0950, with a stop loss at 1.0920 below the channel support.
The take profit was set at 1.1010, near the next channel resistance.
The trade captured 60 pips within a few hours, demonstrating the effectiveness of combining trend slope with signal arrows.
Case Study 2
On the GBP/USD 15-minute chart, the channel slope started declining, signaling a downward trend.
A yellow DOWN arrow appeared from the XMaster Formula.
A sell trade was opened at 1.2350, stop loss was placed at 1.2380 above the channel resistance, and take profit was set at 1.2280 near the next support line.
The trade yielded 70 pips during the day, showing how trend direction plus the XMaster signal can pinpoint high-probability entries.
Strategy Tips
- Always confirm the trend with the Auto Forex Regression Channel before taking XMaster signals
- Use higher time frames to identify the main trend, then trade signals on smaller charts for better accuracy
- Adjust stop loss and take profit according to volatility; tighter ranges require closer levels
- Avoid trading during major news events that can create unpredictable spikes
- Keep a trading journal to track performance and refine the strategy over time
Download Now
Download the “regression_channel.mq4” indicator for Metatrader 4
FAQ
How does the indicator handle sudden market spikes?
The Auto Forex Regression Channel uses a mathematical average to determine its slope.
While a spike might briefly exit the channel, the indicator will adjust its boundaries to incorporate the new volatility.
This prevents the trader from reacting too quickly to temporary market noise.
Is this indicator better for ranging or trending markets?
This tool is exceptionally versatile because it defines the range within a trend.
In a trending market, it shows you the “value” area to buy or sell.
In a ranging market, the channel will sit horizontally, allowing you to trade the bounces between the upper and lower extremes.
Can I change the period of the regression calculation?
Yes, the settings allow you to adjust the number of bars used for the regression analysis.
A higher period will create a smoother, long-term channel.
A shorter period will make the channel more reactive to recent price changes, which is often preferred by day traders.
Summary
The Auto Forex Regression Channel indicator for mt4 provides a comprehensive view of market dynamics by merging price action with momentum filtering.
This dual approach helps traders maintain discipline and consistency.
If you are looking for a reliable way to improve your trade accuracy, you can use the Auto Forex Regression Channel Indicator to enhance your strategy.
This tool is perfect for those who want to spend less time analyzing and more time executing profitable trades.
Whether you are a novice or a pro, this indicator provides the data needed to navigate the forex market successfully.


