
About the Stochastic Forex Trend Reversal Indicator
The Stochastic Forex Trend Reversal indicator for MT4 is designed to help traders anticipate potential market turning points.
Instead of following trends, this indicator focuses on spotting exhaustion zones where price may be ready to reverse.
It is built around a modified stochastic oscillator that highlights extreme market conditions.
The oscillator operates within a defined range and emphasizes two critical levels.
When price momentum stretches too far in one direction, the indicator signals that buyers or sellers may be losing control.
These conditions often precede corrective moves or full trend reversals.
Stochastic Forex Trend Reversal is best suited for traders who look for early entries near market extremes.
It works well across multiple currency pairs and time frames.
The indicator can be used as a standalone reversal tool or combined with trend context for higher-quality setups.
Free Download
Download the “RaitisStoch.mq4” indicator for MT4
Key Features
- Oscillator-based reversal signals focused on extreme price conditions.
- Predefined overbought and oversold zones for easier decision-making.
- Visual dot signals are plotted directly on the chart.
- Effective for spotting early corrective moves.
Indicator Chart
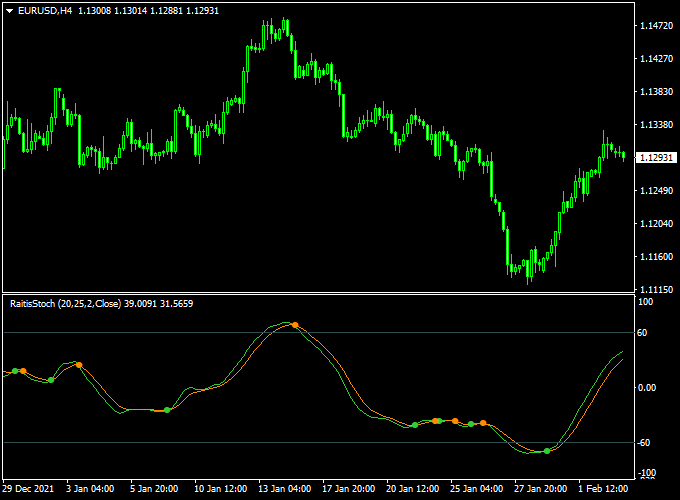
The Stochastic Forex Trend Reversal indicator is displayed in a separate MT4 window below the price chart.
The chart shows an oscillator fluctuating between upper and lower extreme levels.
When price momentum reaches these zones, colored dots appear to highlight potential reversal areas.
This visual setup helps traders prepare for possible changes in direction.
Guide to Trade with the Stochastic Forex Trend Reversal Indicator
Buy Rules
- Monitor the oscillator as it approaches the -60 lower boundary.
- Wait for signs that downward momentum is slowing.
- Enter a buy trade once a bullish signal dot confirms a potential turn.
Sell Rules
- Watch the oscillator as it moves into the upper +60 extreme zone.
- Look for weakening upside momentum near the highs.
- Open a sell trade after a bearish signal dot appears.
Stop Loss
- Set the stop loss slightly beyond the recent high or low.
- Keep risk aligned with the volatility of the chosen time frame.
Take Profit
- Aim for the next visible price reaction level.
- Scale out of the position as price moves away from the extreme zone.
- Close the trade if the oscillator re-enters the extreme area.
Stochastic Trend Reversal + Afirma Indicator MT4 Scalping Strategy
This scalping strategy combines the reversal-detecting power of the Stochastic Forex Trend Reversal Indicator with the trend-following signals of the Afirma Forex Trend Indicator.
The Stochastic indicator identifies potential price reversals with green dots for bullish signals at the -60 oversold level and orange dots for bearish signals at the 60 overbought level.
Afirma confirms the overall trend direction with a blue line for buy and a red line for sell trends.
Combining both allows traders to enter short-term trades aligned with the market momentum.
This strategy works best on 5-minute and 15-minute charts during high-volume trading sessions such as London and New York.
It is suitable for pairs like EUR/JPY, USD/CAD, and GBP/USD, where scalping opportunities are frequent.
Buy Entry Rules
- Wait for a green dot from the Stochastic Trend Reversal indicator at the -60 oversold level.
- Confirm that the Afirma line is blue, indicating a bullish trend.
- Enter a buy trade at the close of the candle where the green dot appears.
- Set a stop loss 10–15 pips below the recent swing low.
- Set take profit at 15–25 pips or exit when Afirma turns red or the Stochastic indicator shows a potential reversal.
Sell Entry Rules
- Wait for an orange dot from the Stochastic Trend Reversal indicator at the 60 overbought level.
- Confirm that the Afirma line is red, indicating a bearish trend.
- Enter a sell trade at the close of the candle where the orange dot appears.
- Set a stop loss 10–15 pips above the recent swing high.
- Set take profit at 15–25 pips or exit when Afirma turns blue or the Stochastic shows a potential reversal.
Advantages
- Combines reversal signals with trend confirmation, increasing trade accuracy.
- Clear visual dots and lines make entries easy to spot for scalpers.
- Works well on multiple currency pairs with intraday volatility.
- Short timeframes allow for quick profits during high-volume sessions.
- Helps avoid trades against the main trend, reducing the risk of false reversals.
Drawbacks
- Signals can be delayed during rapid trend changes, causing missed or late entries.
- Reversal dots may appear multiple times in choppy markets, increasing the risk of false entries.
- Small pip targets require strict money management to avoid losses from spreads.
- Strategy demands constant monitoring due to fast fast-scalping nature.
- Performance may drop in low liquidity sessions or during market consolidations.
- Occasional conflicting signals between the Stochastic and Afirma indicators can create uncertainty.
Example Case Study 1 – EUR/JPY
On the M5 chart, a green dot appeared at -60, with the Afirma line blue.
A buy trade was entered at 145.25, stop loss at 145.10, and take profit at 145.45.
The trade reached the target in 20 minutes, gaining +20 pips.
Example Case Study 2 – USD/CAD
On the M15 chart, an orange dot appeared at 60, with the Afirma line red.
A sell trade was entered at 1.3455, stop loss at 1.3470, and take profit at 1.3430.
The trade hit the target in 35 minutes, yielding +25 pips.
Strategy Tips
- Trade only when the Stochastic reversal dot aligns with the Afirma trend line.
- Focus on active trading hours for better price movement and signal reliability.
- Keep tight stop losses to protect against sudden reversals in fast-moving markets.
- Use small pip targets to match scalping style and reduce exposure.
- Avoid overtrading; only take high-probability setups where both indicators confirm.
- Consider trailing stops for trades that move quickly in your favor to capture additional pips.
- Backtest the strategy on various pairs to identify which ones respond best to reversal and trend alignment.
- Record each trade in a journal to refine entry timing and optimize pip targets based on volatility.
Download Now
Download the “RaitisStoch.mq4” indicator for Metatrader 4
FAQ
Is this indicator better for reversals or trend trading?
It is primarily designed for identifying potential reversals.
It can also capture corrective moves within larger trends.
Which time frames work best with this indicator?
The indicator performs well on M15 and higher time frames.
Higher time frames tend to produce more reliable reversal zones.
Does the indicator give frequent signals?
Signals appear only when price reaches extreme levels.
This helps reduce overtrading and unnecessary entries.
Can it be combined with other indicators?
Yes, it works well with trend filters or support and resistance analysis.
This combination can improve overall trade quality.
Summary
The Stochastic Forex Trend Reversal indicator for MT4 focuses on identifying market exhaustion points.
Its oscillator-based approach helps traders prepare for potential changes in direction.
By highlighting overbought and oversold zones, the indicator supports disciplined reversal trading.
It encourages patience and selective entries.
When used with proper risk management and market context, this indicator can enhance timing and confidence in reversal-based trading strategies.


