About the Percentage Price Oscillator Indicator
The Percentage Price Oscillator Indicator for Metatrader 4 is a momentum-based technical tool that measures the relationship between two exponential moving averages.
Specifically, it calculates the difference between the 12-period and 26-period EMAs and expresses that difference as a percentage.
This allows traders to assess momentum strength relative to price rather than raw point values.
Unlike standard MACD-style indicators, the PPO’s percentage-based output makes it easier to compare momentum across different currency pairs and timeframes.
This is especially useful for traders who monitor multiple instruments.
The indicator appears in a separate MT4 chart window as two colored lines oscillating around the 0.00 level.
PPO is reliable, efficient, and works well for trend-following and momentum-based strategies.
It helps traders identify emerging trends, momentum shifts, and potential continuation setups with minimal chart clutter.
Free Download
Download the “Percentage price oscillator.mq4” indicator for MT4
Key Features
- Measures the percentage difference between 12 and 26-period EMAs.
- Displays two colored oscillator lines in a separate window.
- Uses the 0.00 level as a key momentum reference.
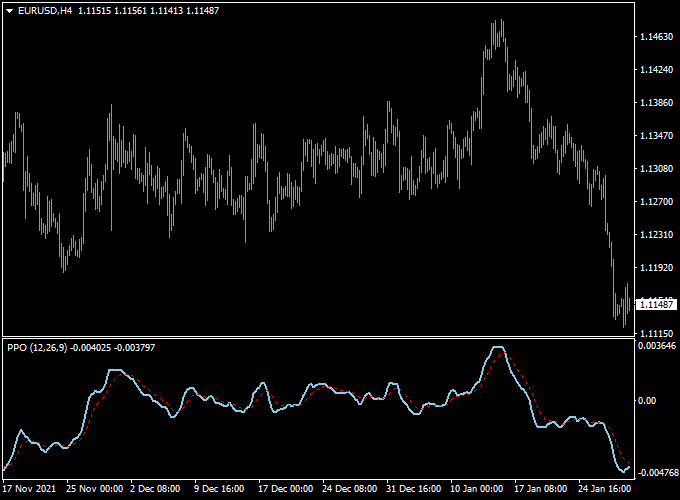
Indicator Chart
The Percentage Price Oscillator indicator chart is displayed in the lower MT4 window.
It shows two colored lines fluctuating above and below the 0.00 level.
Crossovers near the zero line highlight changes in momentum direction.
When the lines move above zero, bullish pressure increases, while movement below zero reflects growing bearish momentum.

Guide to Trade with the Percentage Price Oscillator Indicator
Buy Rules
- Wait for both colored PPO lines to cross back above the 0.00 level.
- Confirm that momentum is shifting from bearish to bullish.
- Ensure price is not directly below strong resistance.
- Enter a buy trade at the close of the signal candle.
Sell Rules
- Wait for both colored PPO lines to cross back below the 0.00 level.
- Confirm bearish momentum is building.
- Check that the price is not sitting on major support.
- Enter a sell trade at the close of the signal candle.
Stop Loss
- For buy trades, place a stop loss 2- 3 pips below the most recent swing low.
- For sell trades, place a stop loss 2- 3 pips above the most recent swing high.
- Allow pip space for normal market fluctuations.
Take Profit
- Target significant short-term support or resistance levels.
- Use a fixed risk-to-reward ratio such as 1:2 or higher.
- Trail stops if momentum continues to strengthen.
- Exit early if the PPO lines flatten or cross back.
Percentage Price Oscillator & Triple Exponential Moving Average Forex Day Trading Strategy
This day trading strategy combines the Percentage Price Oscillator (PPO) Indicator for MT4 with the Triple Exponential Moving Average (TEMA) Indicator for MT4.
The PPO identifies momentum shifts when the two colored lines cross the zero level, signaling potential trend reversals.
The TEMA confirms the trend direction, using a blue line for bullish trends and a red line for bearish trends.
Together, they provide a precise day trading setup with clear entry and exit points.
This strategy works best on M15 to H1 charts and is ideal for day traders seeking structured trades during active market sessions.
It is suitable for major forex pairs such as EUR/USD, GBP/USD, USD/JPY, and AUD/USD.
Buy Entry Rules
- Confirm that the TEMA indicator shows a blue line, signaling a bullish trend.
- Wait for the PPO indicator’s two colored lines to cross back above the 0.00 level from below.
- Enter a buy trade at the close of the confirming candle.
- Place a stop loss below the recent swing low or 20–25 pips, depending on volatility.
- Take profit after 35–60 pips or when the TEMA line changes from blue to red.
Sell Entry Rules
- Confirm that the TEMA indicator shows a red line, signaling a bearish trend.
- Wait for the PPO indicator’s two colored lines to cross back below the 0.00 level from above.
- Enter a sell trade at the close of the confirming candle.
- Place a stop loss above the recent swing high or 20–25 pips.
- Take profit after 35–60 pips or when the TEMA line changes from red to blue.
Advantages
- Combines momentum and trend confirmation for high-probability trades.
- Clear entry signals reduce guesswork and improve timing.
- Works across multiple timeframes and currency pairs.
- Helps avoid countertrend trades by confirming TEMA direction.
Drawbacks
- Waiting for the PPO zero-level cross may delay entries slightly.
- Requires discipline to avoid trading against strong news or spikes.
Case Study 1 – EUR/CHF, M30 Chart
During the London session, the TEMA showed a blue line, confirming a bullish trend.
The PPO indicator lines crossed above 0.00 at 0.9455.
A buy trade was opened at 0.9458 with a stop loss at 0.9435 and a take profit at 0.9500.
Price steadily moved higher, reaching the target within three hours for a +42 pip gain.
Case Study 2 – GBP/JPY, H1 Chart
During the New York session, the TEMA showed a red line, indicating a bearish trend.
The PPO lines crossed below 0.00 at 193.20, signaling a sell.
A short trade was entered at 193.18 with a stop loss at 193.50 and a target at 192.65.
The pair moved in the expected direction over four hours, reaching the target for a +53 pip profit.
Strategy Tips
- Focus on trending pairs for stronger and more reliable moves.
- Trade during active sessions, such as London and New York for better momentum.
- Use trailing stops to secure profits if the trade moves quickly in your favor.
- Only enter trades when PPO and TEMA signals align to improve accuracy.
Download Now
Download the “Percentage price oscillator.mq4” indicator for Metatrader 4
FAQ
How is PPO different from MACD?
PPO expresses the EMA difference as a percentage instead of raw values.
This makes it easier to compare momentum across different instruments and price ranges.
Is PPO better suited for trend trading?
Yes, it performs best in trending markets.
Strong moves above or below the zero line often confirm trend continuation.
Which timeframes work best?
It works well on all timeframes.
Higher timeframes offer stronger signals, while lower timeframes provide faster entries with more noise.
Summary
The Percentage Price Oscillator Indicator for MT4 is a dependable momentum tool that highlights the relationship between key moving averages.
By expressing momentum in percentage terms, it offers consistency across different markets.
For buy trades, look for the PPO lines crossing back above the 0.00 level to confirm bullish momentum.
For sell trades, focus on crosses below the zero line that signal bearish pressure.
When combined with sound risk management and basic market context, it supports disciplined and confident momentum-based trading.


