About the Spearman Correlation Forex Indicator
The Spearman Correlation Forex Indicator for Metatrader 4 is an oscillator-based trading tool designed to measure trend strength and direction.
It applies Spearman correlation logic to price movement, helping traders determine whether the market is trending in a consistent direction.
This makes it useful for trend traders who want confirmation before entering a position.
The indicator appears in a separate bottom window and combines colored correlation lines with directional arrows.
These elements work together to highlight potential buying and selling opportunities when correlation strength aligns with price direction.
Blue arrows signal bullish momentum, while yellow arrows indicate bearish pressure.
It works on all currency pairs and timeframes, making it suitable for both intraday and swing trading strategies that rely on trend confirmation.
Free Download
Download the “pearson & spearman_smooth.mq4” indicator for MT4
Key Features
- Uses Spearman correlation to evaluate trend strength.
- Displays buy and sell arrows for trade execution.
- Includes colored oscillator lines in a separate window.
- Lightweight and efficient on the MT4 platform.
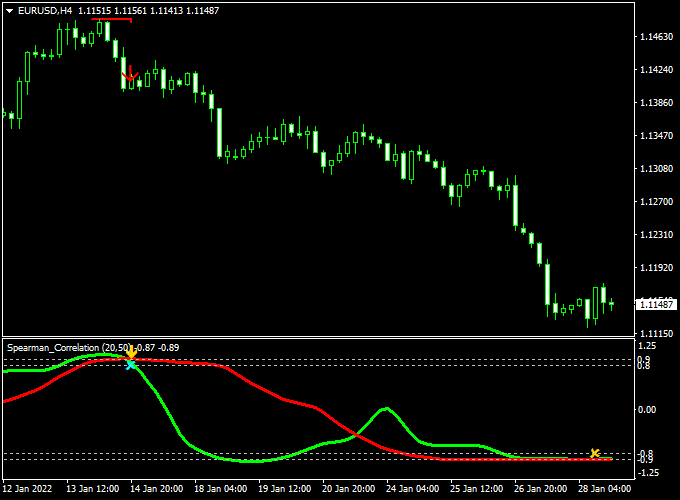
Indicator Chart
The Spearman Correlation Forex indicator chart is shown in the lower window of MT4.
It features colored correlation lines that reflect market direction and momentum.
Buy and sell arrows are printed when correlation conditions align with directional bias.
This helps traders visually confirm trend continuation and avoid low-quality sideways setups.

Guide to Trade with Spearman Correlation Forex Indicator
Buy Rules
- Wait for a blue buy arrow to appear in the indicator window.
- Confirm that the correlation line supports bullish direction.
- Ensure price is not near strong resistance.
- Enter a buy trade at the close of the signal candle.
Sell Rules
- Wait for a yellow sell arrow to appear in the indicator window.
- Confirm bearish correlation from the oscillator line.
- Check that price is not sitting on major support.
- Enter a sell trade at the close of the signal candle.
Stop Loss
- For buy trades, place a stop loss below the most recent swing low.
- For sell trades, place a stop loss above the most recent swing high.
- Allow enough space for normal volatility.
- Adjust stop size according to the timeframe and pair behavior.
Take Profit
- Target the next key support or resistance level.
- Use a minimum risk-to-reward ratio of 1:2.
- Trail stops when correlation remains strong.
- Exit the trade if an opposite arrow appears.
Spearman Correlation & Moving Average Trend Dashboard MT4 Day Trading Strategy
This day trading strategy combines the Spearman Correlation Forex Indicator for MT4 with the Moving Average Trend Dashboard Indicator for MT4.
The Spearman indicator identifies short-term trend momentum through buy and sell arrows, while the dashboard confirms the overall trend across multiple timeframes.
By combining these two tools, traders can enter high-probability trades aligned with both immediate momentum and broader trend direction.
This strategy works best on M15 and H1 charts, making it ideal for day traders who want structured trades lasting a few hours.
It is suitable for major currency pairs such as EUR/USD, GBP/USD, USD/JPY, and AUD/USD.
Buy Entry Rules
- Confirm that the Moving Average Trend Dashboard shows a majority of blue buy arrows across timeframes.
- Wait for a blue buy arrow from the Spearman Correlation indicator on the chart.
- Enter a long trade at the close of the candle where the blue arrow appears.
- Set a stop loss below the recent swing low or 20–25 pips, depending on volatility.
- Take profit at 40–60 pips or when a red sell arrow appears on the dashboard or Spearman indicator.
Sell Entry Rules
- Confirm that the dashboard shows a majority of red sell arrows across timeframes.
- Wait for a yellow sell arrow from the Spearman Correlation indicator on the chart.
- Enter a short trade at the close of the candle with the yellow arrow.
- Place a stop loss above the recent swing high or 20–25 pips.
- Take profit after 40–60 pips or when a blue buy arrow appears on the dashboard or Spearman indicator.
Advantages
- Combines short-term momentum and multi-timeframe trend confirmation.
- Helps filter out false signals and improves trade accuracy.
- A visual dashboard makes trend alignment easy to monitor.
- Suitable for multiple currency pairs and trading sessions.
Drawbacks
- Requires patience to wait for both Spearman and dashboard confirmations.
- Trades may be missed if the arrows appear only briefly or slightly delayed.
- Not suitable for very short-term scalping due to the multi-timeframe confirmation requirement.
Case Study 1 – EUR/GBP, M15 Chart
During the London session, the Moving Average Trend Dashboard showed most timeframes with blue buy arrows, indicating a bullish trend.
Shortly after, the Spearman Correlation indicator printed a blue arrow at 0.8725.
A buy trade was entered at 0.8726 with a stop loss at 0.8705 and a take profit at 0.8760.
Over the next two hours, the price moved in the expected direction, achieving a +34 pip gain.
Case Study 2 – USD/CAD, H1 Chart
During the New York session, the dashboard displayed red sell arrows across the majority of timeframes, confirming bearish conditions.
The Spearman indicator printed a yellow sell arrow at 1.3340.
A short trade was opened at 1.3338 with a stop loss at 1.3355 and a take profit at 1.3295.
Price fell steadily over three hours, resulting in a +43 pip profit.
Strategy Tips
- Focus on high-liquidity pairs for tighter spreads and better execution.
- Trade during active sessions, such as London and New York, for stronger trends.
- Consider using a trailing stop once the price moves 50% toward the target to lock in profits.
- Always confirm that both the Spearman indicator and dashboard signals align before entering a trade.
Download Now
Download the “pearson & spearman_smooth.mq4” indicator for Metatrader 4
FAQ
What does the Spearman Correlation measure?
It measures how consistently the price is moving in one direction.
Stronger correlation values suggest a more reliable trend environment.
Is this indicator better for trending markets?
Yes, it performs best when markets show directional movement.
In sideways conditions, correlation weakens and signals become less frequent.
Can it be combined with price action?
Yes, combining correlation signals with support, resistance, or candle behavior improves entry accuracy and confidence.
Summary
The Spearman Correlation Forex Indicator for MT4 helps traders identify and trade stronger market trends.
By using correlation logic, it filters out weak or inconsistent price movement.
This indicator is easy to use, responsive, and adaptable across timeframes.
With proper risk management and trend awareness, it can support more disciplined and confident trend-based trading.


