
About the Parabolic SAR Alert Indicator
The Parabolic SAR Alert Indicator for MT4 is a trend-following tool built around the classic Parabolic SAR trading method.
Its main purpose is to help traders identify changes in market direction as early as possible.
By tracking price acceleration, the indicator highlights moments when trends may be starting, ending, or reversing.
The indicator plots an orange dotted Parabolic SAR line directly on the main MT4 chart.
These dots shift from above to below the price, or vice versa, depending on the current trend direction.
When combined with alerts, the indicator helps traders react quickly without constantly monitoring the screen.
You can also adjust the step value in the indicator settings to make signals faster or more conservative.
Free Download
Download the “Parabolic_Alert.mq4” indicator for MT4
Key Features
- Based on the proven Parabolic SAR trend-following method.
- Plots orange SAR dots directly on the price chart.
- Provides alerts when trend direction changes.
- Adjustable settings for different trading styles.
- Works across all time frames and currency pairs.
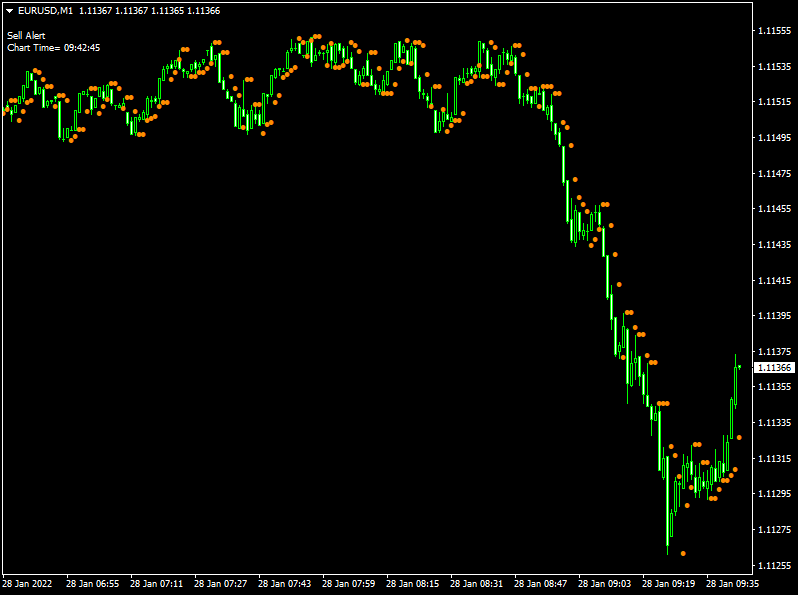
Indicator Chart
The Parabolic SAR Alert Indicator chart displays an orange dotted line above or below price candles.
Dots below the candlesticks indicate bullish conditions, while dots above signal bearish pressure.
As price moves, the SAR dots flip position, helping traders visualize trend shifts and trailing stop behavior.
This layout supports disciplined trend trading and timely exits.
Guide to Trade with Parabolic SAR Alert Indicator
Buy Rules
- Open a buy trade when the first orange SAR dot prints below the candlestick.
- Confirm that the price continues to hold above the SAR dots.
Sell Rules
- Open a sell trade when the first orange SAR dot appears above the candlestick.
- Confirm that the price remains below the SAR dots.
Stop Loss
- Use the Parabolic SAR dots as a dynamic trailing stop.
- Exit the trade if price closes beyond the SAR position.
- Allow room for volatility on higher time frames.
Take Profit
- Let profits run while SAR dots remain on the correct side of price.
- Secure gains near major support or resistance levels.
- Close the trade when the SAR flips against the position.
Parabolic SAR & Weighted Moving Average Cross MT4 Scalping Strategy
This scalping strategy combines the Parabolic SAR Alert Indicator for MT4 with the Weighted Moving Average Cross Indicator for MT4 to deliver fast, accurate signals ideal for short-term traders.
It’s designed for scalpers who prefer quick in-and-out trades within volatile sessions.
The Parabolic SAR confirms early momentum changes, while the Weighted Moving Average Cross validates those signals for higher accuracy.
The combination helps traders catch early reversals and align with the short-term trend, reducing false entries.
It works effectively on 1-minute to 15-minute charts and is especially suited for active traders focusing on pairs like EUR/USD, GBP/USD, and USD/JPY during high liquidity sessions.
Buy Entry Rules
- Wait for the orange Parabolic SAR dot to appear below the candlestick, indicating potential bullish momentum.
- Confirm the buy setup when the red line crosses the blue line from bottom to top on the Weighted Moving Average Cross Indicator.
- Open a buy position once both conditions align on the same or consecutive candles.
- Set a stop loss 10–15 pips below the last swing low.
- Take profit at 20–30 pips or when a new red Parabolic SAR dot appears above the price.
Sell Entry Rules
- Wait for the orange Parabolic SAR dot to appear above the candlestick, signaling a possible bearish reversal.
- Confirm the sell setup when the red line crosses the blue line from top to bottom.
- Open a sell trade once both confirmations appear close together.
- Set a stop loss 10–15 pips above the last swing high.
- Take profit at 20–30 pips or when a new orange dot appears below the candle.
Advantages
- Combines trend and momentum signals for higher precision.
- Ideal for quick scalp trades during volatile market hours.
- Minimizes lag with responsive Weighted Moving Average confirmation.
- Works across major forex pairs and fast time frames.
Drawbacks
- Requires fast execution and strict stop loss management.
- Not suitable for traders who prefer holding positions for long durations.
Case Study 1 – EUR/USD, M5 Chart
During the London open, the Parabolic SAR printed an orange dot below the EUR/USD 5-minute candle, signaling early bullish pressure.
A few candles later, the red line crossed above the blue line, confirming the buy signal.
The entry was taken at 1.0740, with a stop loss at 1.0725 and a target at 1.0770.
Within 45 minutes, the price hit the target, producing a clean +30 pips gain.
Case Study 2 – GBP/JPY, M1 Chart
On the 1-minute chart, a sell signal appeared as the Parabolic SAR plotted a dot above the price, while the red line crossed below the blue line shortly after.
The entry at 193.40 with a 15-pip stop loss led to a sharp move down to 193.00.
The position was closed for +40 pips in under 20 minutes during the Tokyo session volatility.
Strategy Tips
- Focus on high-volume sessions (London and New York) for more reliable signals.
- Avoid trading during major economic news releases to prevent sudden reversals.
- Use trailing stops to lock in profits when trades move strongly in your favor.
- Consider combining this setup with a volatility filter like ATR to gauge realistic scalp targets.
Download Now
Download the “Parabolic_Alert.mq4” indicator for Metatrader 4
FAQ
What makes the alert feature useful?
Alerts notify traders when the SAR changes position.
This helps catch trend shifts without watching the chart continuously.
How does the step value affect signals?
Lower step values create smoother signals.
Higher values make the indicator react faster but may increase noise.
Is Parabolic SAR better for trending markets?
Yes, it performs best during strong directional movement.
Choppy markets may produce frequent flips.
Summary
The Parabolic SAR Alert Indicator for MT4 offers a disciplined way to follow market trends using a time-tested method.
Its on-chart dots and alert functionality help traders react quickly to changes in direction.
By focusing on trend continuation and reversal points, it supports structured trade management.
With adjustable settings and broad market compatibility, the indicator adapts to different trading styles.
When combined with sound risk control and market context, it can become a dependable part of a trend-focused MT4 trading setup.
For traders who value timely alerts and straightforward logic, this tool delivers consistent practical value.


