About the NRTR Trend-Following Indicator
The NRTR Trend-Following Indicator is a simple yet effective trend trading tool designed for MetaTrader 4 users.
As its name suggests, it focuses on identifying sustained market direction while also providing practical stop loss guidance directly on the chart.
The indicator appears in the main MT4 chart window as colored dots plotted along price action.
Blue dots signal bullish trend conditions, while red dots indicate bearish momentum.
These dots act as both entry signals and dynamic reference points for trade management.
The NRTR Trend-Following Indicator works across all currency pairs and timeframes, offering flexibility for different trading styles.
Free Download
Download the “NRTR.mq4” indicator for MT4
Key Features
- Trend-following indicator with visual dot signals.
- Blue dots indicate bullish trend direction.
- Red dots indicate bearish trend direction.
- Suggested stop loss placement built into the logic.
- Suitable for both trade entries and exits.
- Beginner-friendly and easy to interpret.
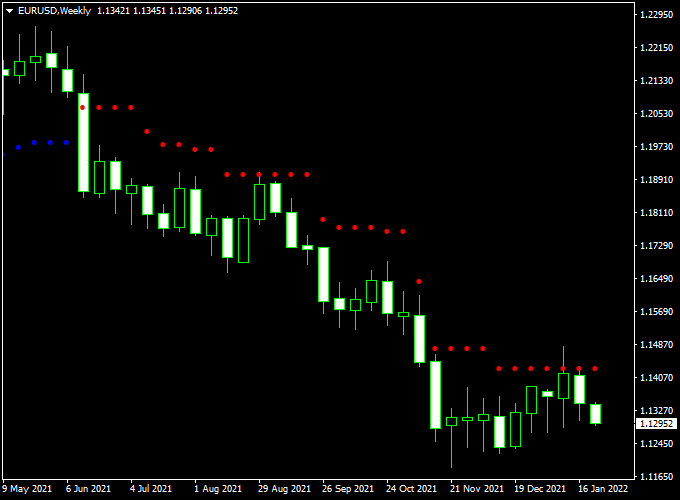
Indicator Chart
The chart shows the NRTR Trend-Following Indicator displayed in the main MT4 window.
Colored dots follow price movement and adjust as the trend develops.
Blue dots trail below price during upward trends, while red dots trail above price during downward trends.
Traders use these dots to stay aligned with trend direction and manage risk effectively.

Guide to Trade with NRTR Trend-Following Indicator
Buy Rules
- Wait for a blue dot to appear on the chart.
- Confirm that price is trading above recent dots.
- Ensure market conditions support trend continuation.
- Open a buy trade following the blue dot signal.
Sell Rules
- Wait for a red dot to appear on the chart.
- Confirm that price is trading below recent dots.
- Check for sustained bearish pressure.
- Open a sell trade after the red dot forms.
Stop Loss
- Place the stop loss a few pips below the blue dots for buy trades.
- Place the stop loss a few pips above the red dots for sell trades.
- Adjust buffer size based on market volatility.
- Keep risk proportional to account size.
Take Profit
- Hold trades while dots remain the same color.
- Exit when an opposite color dot appears.
- Use higher timeframe levels as profit references.
- Secure profits during extended trend moves.
Free Forex Scalping Indicator Forex Strategy for MT4
This MT4 scalping strategy combines the NRTR Trend Following Forex Indicator and the Free Forex Scalping Indicator to capture quick and precise intraday trades.
The NRTR Indicator identifies the current market direction through colored dots, while the Free Forex Scalping Indicator confirms entry timing with a histogram that turns green or red.
Together, they create a powerful scalping setup suitable for fast time frames like M1, M5, and M15.
The goal of this strategy is to enter trades in the direction of the established NRTR trend, only when the histogram confirms momentum.
It’s designed for active traders who prefer high-probability setups with defined stops and short profit targets.
Because both indicators react quickly to price action, this system works best on volatile pairs such as EUR/USD, GBP/JPY, and AUD/USD during major sessions.
Buy Entry Rules
- Wait until the NRTR Trend Following Indicator prints blue dots below the price, indicating an upward trend.
- Confirm that the Free Forex Scalping Indicator histogram turns green, showing bullish momentum.
- Enter a buy trade immediately when both signals align.
- Place the stop loss a few pips below the latest blue NRTR dot.
- Take profit after 10–20 pips or when the histogram turns red.
Sell Entry Rules
- Wait until the NRTR Trend Following Indicator prints red dots above the price, indicating a bearish trend.
- Confirm that the Free Forex Scalping Indicator histogram turns red, signaling strong downside momentum.
- Enter a sell trade when both signals appear in the same direction.
- Place the stop loss a few pips above the latest red NRTR dot.
- Take profit after 10–20 pips or when the histogram flips green.
Advantages
- Combines trend detection and momentum confirmation for greater accuracy.
- Provides clear visual cues for easy trade execution.
- Non-repainting signals make it reliable during live trading.
- Suitable for all major currency pairs and short-term trading sessions.
- Helps identify precise entries with small stop losses for improved reward-to-risk ratio.
Drawbacks
- Choppy or sideways markets can produce false signals and small losses.
- Frequent trades may increase transaction costs, especially on pairs with wider spreads.
- Requires fast execution; delays can affect profitability.
- Should not be used on higher time frames, as it’s optimized for scalping.
- Unexpected news events can invalidate setups and trigger reversals.
Case Study 1 – EUR/USD 5-Minute Chart
During the London session, the NRTR Indicator printed blue dots below the price at 1.0760, showing a developing bullish trend.
Soon after, the Free Forex Scalping Indicator’s histogram turned green.
A buy trade was opened at 1.0762, with a stop loss at 1.0752 and a take profit at 1.0782.
The price advanced steadily and hit the target within 25 minutes, generating a clean 20-pip profit.
The combined confirmation ensured that the trade followed both trend and momentum.
Case Study 2 – GBP/JPY 15-Minute Chart
On the GBP/JPY chart, the NRTR dots switched to red at 192.30, indicating a bearish reversal.
Shortly after, the Free Forex Scalping histogram turned red.
A sell trade was executed at 192.25 with a stop loss at 192.55 and a target at 191.90.
Within one hour, the price reached the target for a 35-pip gain.
The synchronization between both indicators provided an accurate entry point at the start of the downtrend.
Strategy Tips
- Focus on high-volume pairs like EUR/USD, GBP/JPY, and USD/CHF for the best performance.
- Trade during active sessions (London or New York) for stronger follow-through.
- Stick to small profit targets and exit as soon as the histogram changes color.
- Use proper money management: limit risk to 1–2% per trade and avoid overtrading.
- Always confirm that the trend direction (dots) matches the histogram color before entering.
Download Now
Download the “NRTR.mq4” indicator for Metatrader 4
FAQ
How does the NRTR indicator define trend direction?
The indicator follows price movement and adjusts its dots based on sustained momentum.
Blue dots reflect upward pressure, while red dots reflect downward pressure.
Can the dot levels be used as trailing protection?
Yes, traders often move their stop loss along the dots as price advances, allowing the trade to stay open while the trend remains active.
Is the indicator suitable for fast markets?
It performs best during stable trending conditions. In highly choppy markets, signals may change more frequently.
Can it be combined with other indicators?
The NRTR indicator works well alongside momentum or volume tools to filter out weaker trend signals.
Summary
The NRTR Trend-Following Indicator for MT4 delivers practical trend signals through simple colored dots placed directly on the chart.
This visual approach helps traders stay aligned with market direction while managing trades efficiently.
Its ability to provide both entry guidance and dynamic stop references makes it a useful tool for traders seeking a clean, trend-based workflow.
With proper market selection and disciplined execution, the indicator can become a reliable part of a structured trading plan.


