
About the MTF Support and Resistance Forex Indicator
The MTF Support and Resistance Forex indicator for MT4 (Metatrader 4) identifies and displays significant S&R levels across multiple time frames directly on your chart.
It helps traders anticipate where price may stall, bounce, or reverse based on historical turning points.
Support and resistance are foundational concepts in technical analysis, and this indicator simplifies their identification without manual drawing.
MTF stands for multi-time frame, meaning the indicator can show S&R levels from higher time frames while you trade on a lower one.
Traders use these levels for entry timing, stop loss placement, and take profit targets.
Because it automatically adapts to evolving market conditions, the MTF Support and Resistance indicator allows you to focus on price action and trade management.
Free Download
Download the “Mtf resistance support.mq4” indicator for MT4
Key Features
- Automatically detects and displays support and resistance zones on multiple time frames.
- Useful for trade entry, exit, and risk management.
- Helps identify trend continuation and reversal areas.
Indicator Chart
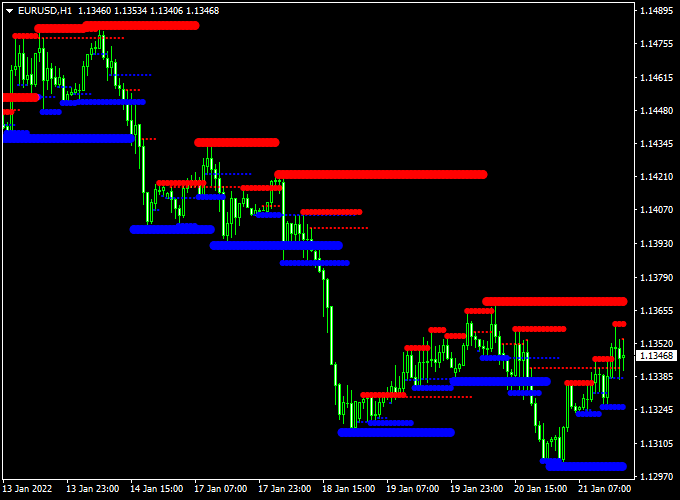
The MTF Support and Resistance Forex indicator chart overlays key levels on the MT4 price chart.
Horizontal lines represent areas where price previously reacted or reversed.
Major support and resistance levels reflect significant price interest zones.
Minor levels show recent reaction points that can also influence intraday moves.
Guide to Trade with MTF Support and Resistance Forex Indicator
Buy Rules
- Determine the overall trend using a higher time frame or trend indicator.
- Wait for the price to approach a major or minor support level.
- Confirm bullish price action near the support zone.
- Enter a buy trade as the price shows strength off support.
Sell Rules
- Confirm bearish trend or corrective pullback.
- Wait for the price to approach a major or minor resistance level.
- Look for bearish reversal signals near resistance.
- Enter a sell trade when the price rejects the resistance zone.
Stop Loss
- Place a stop loss beyond the support level for buy trades.
- Place a stop loss above the resistance zone for sell trades.
- Adjust stops based on volatility and your risk tolerance.
Take Profit
- Use the next major support or resistance zone as the first take profit target.
- Consider partial profits at minor levels along the way.
- Exit fully when price shows signs of reversal near the next zone.
Practical Tips
- Use higher time frame S&R levels for better context on key zones.
- Avoid entering trades when the price is far from any significant level.
- Combine the indicator with price action for confirmation before entry.
- Pay attention to session volatility, as levels may be tested more often during active hours.
MTF Support & Resistance and Best Scalping Indicator Forex Strategy
The MTF Support Resistance Forex Indicator and the Best Forex Scalping Indicator for MT4 create a simple yet effective short-term trading strategy.
This combination uses real-time support and resistance zones to filter trades while relying on the precise buy and sell signals from the scalping indicator.
The strategy works best on the M5 and M15 charts, making it suitable for traders who prefer quick in-and-out trades within active market sessions.
The MTF Support Resistance indicator marks key price levels that are derived from multiple time frames, allowing traders to identify high-probability reaction zones.
The Scalping Indicator plots blue arrows for buy signals and red arrows for sell signals.
By aligning these signals with the support and resistance levels, traders can enter trades with more confidence and minimize exposure to false breakouts.
Buy Entry Rules
- Wait until the price approaches or touches a support zone drawn by the MTF Support Resistance indicator.
- Watch for a blue arrow to appear from the scalping indicator near or inside this zone.
- Enter a buy trade as soon as the next candle opens after the blue arrow appears.
- Place a stop loss just below the support level or recent swing low.
- Set take profit at the nearest resistance zone or after achieving at least a 1:2 risk-reward ratio.
Sell Entry Rules
- Wait until the price approaches or touches a resistance zone from the MTF Support Resistance indicator.
- Watch for a red arrow from the scalping indicator to appear near or inside this resistance area.
- Enter a sell trade when the next candle opens after the red arrow signal.
- Place a stop loss above the resistance level or the latest swing high.
- Take profit at the next support zone or after reaching a 1:2 risk-reward target.
Advantages
- Combines market structure with precise entry signals.
- Provides clear visual cues that are easy to follow in real time.
- Reduces false entries by confirming trades at major support or resistance levels.
- Works on multiple pairs and short-term charts.
- Ideal for traders who prefer quick trades during high volatility periods.
Drawbacks
- Signals may appear late if market conditions change rapidly.
- False breakouts can still occur during news releases or strong momentum spikes.
- Not well-suited for trending markets with little retracement.
- Requires close monitoring and fast execution due to short time frames.
Case Study 1: EUR/USD M5 Example
On the EUR/USD M5 chart, the MTF Support Resistance indicator displayed a clear support zone around 1.0720.
As the price touched this level, a blue arrow appeared from the scalping indicator.
A buy trade was opened at 1.0723 with a stop loss at 1.0712.
Within 30 minutes, the pair climbed to the next resistance at 1.0745, securing a profit of about 22 pips before exiting at the resistance zone.
Case Study 2: GBP/USD M15 Example
In this scenario, the GBP/USD pair tested a resistance area at 1.2800.
The scalping indicator printed a red arrow near this zone, confirming a potential reversal.
A sell order was opened at 1.2795 with a stop loss at 1.2810.
The pair dropped to 1.2760 over the next hour, generating around 35 pips of profit before showing a blue reversal signal.
Strategy Tips
- Focus on liquid pairs such as EUR/USD, GBP/USD, and USD/JPY for tighter spreads.
- Avoid trading during major economic events to prevent unpredictable volatility.
- Use a trailing stop to lock in profits during strong moves.
- Wait for the price to touch or closely approach support or resistance before acting on any signal.
- Keep risk per trade below 2% to protect your capital during high-frequency setups.
Download Now
Download the “Mtf resistance support.mq4” indicator for Metatrader 4
FAQ
What does MTF mean?
MTF stands for multi-time frame. It means the indicator can show support and resistance levels from higher time frames while you trade on a lower chart.
This adds context and helps identify stronger barriers.
Can this indicator be used for scalping?
Yes, the indicator works on all time frames.
Scalpers may use supported levels on shorter time frames, while swing traders may focus on higher time frame zones.
Does the indicator redraw levels often?
The indicator updates levels as new price data comes in.
Higher time frame zones remain stable, while lower time frame levels may update more frequently.
Should I draw support and resistance manually too?
This indicator automatically identifies key levels, but manual confirmation using price action sometimes adds confidence.
Combining both can improve decision quality.
Summary
The MTF Support and Resistance Forex indicator for MT4 automatically finds and displays key price barriers across multiple time frames.
It helps traders plan entries near support and exits near resistance while managing risk effectively.
For buy trades, open a position near support in an uptrend, aiming to ‘buy the dip’.
For sell trades, look for resistance in a downtrend and aim to ‘sell the rally’.
These straightforward rules align with traditional price action techniques.


