
About the 10 Minute Trader Indicator
The 10 Minute Trader Indicator for MT4 is a high-frequency signal tool built to identify immediate shifts in market momentum.
Its essential function is to provide traders with reactive entry triggers through a series of purple arrows and supportive price dots.
By analyzing short-term price velocity, the indicator predicts where the market is likely to head in the next few candles.
This tool is a vital asset for traders who focus on quick executions and need a simplified visual guide to determine if the immediate bias is bullish or bearish.
Free Download
Download the “10-minute-trader.ex4” MT4 indicator
Key Features
- The indicator provides instant buy and sell signals via purple up and down arrows.
- It includes dynamic trailing dots that serve as visual markers for stop loss placement.
- The tool is optimized for short-term trend predictions across any currency pair.
- It works effectively on lower timeframes, making it a favorite for scalping strategies.
- The signal logic helps traders filter out minor fluctuations to focus on immediate momentum.
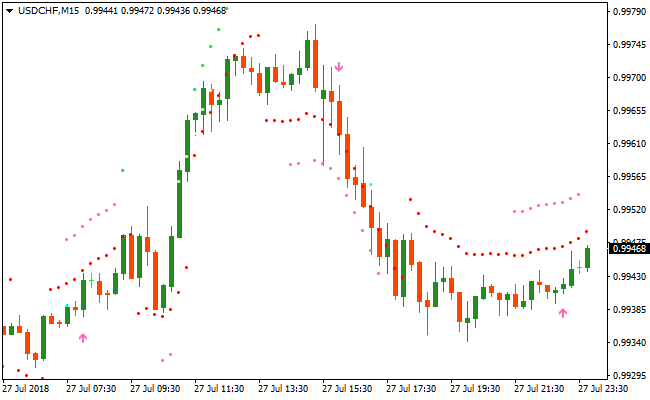
Indicator Chart
The chart displays the 10 Minute Trader Indicator with clear purple arrows plotted against the price bars.
You can see an up arrow initiating a bullish move, while the downward arrows mark the start of short-term selling pressure.
The accompanying dots provide a continuous reference for price stability.
Guide to Trade with 10 Minute Trader Indicator
Buy Rules
- Identify a bullish trend using a higher-period exponential moving average.
- Wait for the 10 Minute Trader Indicator to print a purple up arrow on the chart.
- Ensure the arrow aligns with upward momentum before entering the position.
- Open a buy trade at the start of the next candle following the signal.
Sell Rules
- Identify a bearish trend using a higher-period exponential moving average.
- Wait for the 10 Minute Trader Indicator to print a purple down arrow on the chart.
- Confirm that the market is showing downward pressure below the moving average.
- Open a sell trade at the start of the next candle following the signal.
Stop Loss
- For buy trades, place the stop loss directly below the indicator dots.
- For sell trades, place the stop loss directly above the indicator dots.
- Adjust the stop loss if a new dot appears to lock in profits as the trend progresses.
Take Profit
- Exit the trade immediately when an opposite signal arrow appears on the chart.
- Alternatively, set a fixed profit target based on recent local support or resistance.
- Consider closing the position if the price closes on the opposite side of the dots.
10 Minute Trader and Lucky Reversal Indicator Forex Trend Strategy
This MT4 trend reversal strategy combines the precision of the 10 Minute Trader indicator with the confirmation power of the Lucky Reversal Indicator MT4.
The goal is to capture high probability short term reversals after a brief exhaustion move, while still trading in alignment with the dominant intraday direction.
The 10 Minute Trader indicator focuses on short term momentum shifts and displays clear arrow signals that help traders identify when price is ready to move in a new direction.
The Lucky Reversal indicator filters false signals by highlighting potential reversal zones where price is statistically more likely to react.
When combined, these indicators create a balanced MT4 strategy that avoids late entries and improves timing.
This strategy works best on M5 and M15 timeframes and is suitable for scalpers and active day traders who prefer structured rules and visual signals.
It performs well on major forex pairs such as EURUSD, GBPUSD, and USDJPY during the London and New York sessions where volatility is consistent.
Buy Entry Rules
- Confirm that the 10 Minute Trader indicator prints an up arrow on the chart.
- Wait for the Lucky Reversal indicator to show a blue arrow near a recent pullback or support area.
- Enter a buy trade at the close of the signal candle.
- Place the stop loss a few pips below the most recent swing low.
- Set the take profit at a minimum of two times the stop loss or near the next resistance zone.
Sell Entry Rules
- Confirm that the 10 Minute Trader indicator prints a down arrow on the chart.
- Wait for the Lucky Reversal indicator to show a red arrow near a recent pullback or resistance area.
- Enter a sell trade at the close of the signal candle.
- Place the stop loss a few pips above the most recent swing high.
- Set the take profit at a minimum of two times the stop loss or near the next support zone.
Advantages
- Signals appear early in the move, allowing entries closer to optimal price levels.
- The combination reduces overtrading by requiring confirmation from two indicators.
- Helps identify exhaustion points after fast intraday moves.
- Can be integrated easily with manual support and resistance analysis.
Drawbacks
- Reversal signals may fail in very strong trending markets.
- Requires active monitoring due to short timeframe execution.
- Performance may vary across brokers with different spreads and execution speeds.
Case Study 1
On EURUSD M5 during the London session, price declined sharply into a short term support level.
The 10 Minute Trader indicator then printed an up arrow, signaling a potential momentum shift.
Shortly after, the Lucky Reversal indicator displayed a blue arrow confirming a reversal setup.
A buy trade was entered with a tight stop below the recent low.
Price moved steadily upward and reached the predefined take profit for a gain of approximately 28 pips within 40 minutes.
Case Study 2
On GBPUSD M15 during the New York session, price rallied into a resistance zone after a strong bullish move.
The 10 Minute Trader indicator produced a down arrow, suggesting weakening upward momentum.
The Lucky Reversal indicator followed with a red arrow near the session high.
A sell trade was placed with a stop above the swing high.
The market reversed cleanly and delivered a 35 pip profit before showing signs of consolidation.
Strategy Tips
- Focus on trading during high liquidity periods to improve signal reliability.
- Wait for candle close confirmation to avoid reacting to temporary price spikes.
- Use a higher timeframe structure to identify key reversal zones before entering.
- Avoid taking multiple trades in the same direction after an extended move.
- Keep risk per trade fixed to maintain consistency over a series of trades.
- Exit partially at the first target and let the remaining position run when momentum continues.
- Skip setups that appear directly before major economic announcements.
Download Now
Download the “10-minute-trader.ex4” Metatrader 4 indicator
FAQ
What is the purpose of the dots following the price?
The dots represent a trailing support and resistance mechanism.
They help you stay in the trade while the momentum is strong and provide a clear, objective level for your stop loss placement.
Can I use this indicator on the 1-minute timeframe?
Yes, the 10 Minute Trader Indicator is designed for speed.
It is highly effective on the M1 and M5 timeframes for traders looking to capture several small price movements throughout the day.
How do I avoid signals in a flat market?
The best approach is to only trade signals that align with a 50 or 100-period moving average.
If the moving average is flat, it is better to stay on the sidelines until a clear slope develops.
Summary
The 10 Minute Trader Indicator is a powerful solution for those who prefer an active and direct trading style.
Its primary benefit is the combination of entry arrows and protective dots, which streamlines both the execution and risk management process.
By focusing on short-term trend predictions, it allows traders to enter and exit the market with high precision.
When used alongside a longer-term trend filter, it becomes an excellent tool for building a consistent and disciplined trading routine.


