About the Forex Market Spread and Pip Value Indicator
The Forex Market Spread and Pip Value indicator is a free MT4 tool designed to help traders manage costs and position sizing more effectively.
Instead of switching between calculators or external tools, this indicator displays essential trading data directly on the chart.
This allows traders to make faster and more informed decisions before entering a trade.
The indicator shows the current spread, the pip value per lot, and the remaining time until the next candle forms.
All information appears in the main MT4 chart window, updating in real time as market conditions change.
Free Download
Download the “Market Value PipValue, Spread, Candle Close time.mq4” indicator for MT4
Key Features
- Displays live spread directly on the MT4 chart.
- Shows pip value per lot for accurate position sizing.
- Includes a countdown timer to the next candle.
- Updates automatically as market conditions change.
- Supports better risk and trade management.
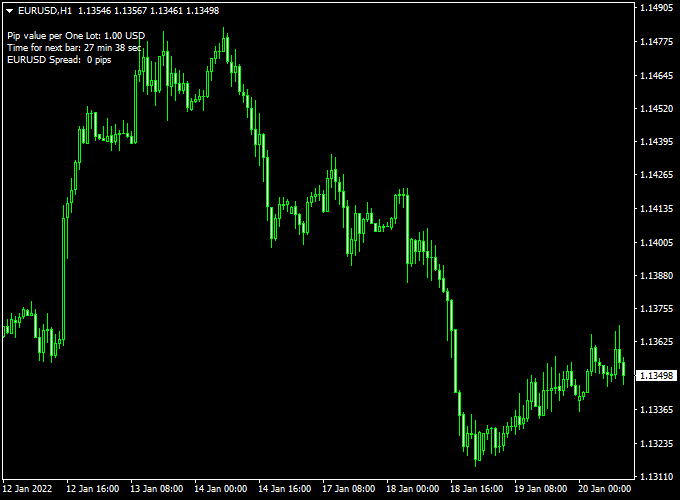
Indicator Chart
The Forex Market Spread and Pip Value indicator chart displays numerical trading data directly on the price chart.
Traders can see the current spread, pip value per lot, and time remaining for the active candle, allowing quick assessment of trading conditions before entry.

Guide to Trade with Forex Market Spread and Pip Value Indicator
Buy Rules
- Check that the spread is within an acceptable range before entering a buy trade.
- Confirm the pip value per lot matches your risk plan.
- Enter the trade when market conditions are stable.
Sell Rules
- Verify the spread is not excessively wide before selling.
- Use the pip value display to calculate position size.
- Enter the trade only when execution conditions are favorable.
Stop Loss
- Calculate stop loss distance using pip value information.
- Adjust stop placement based on current spread conditions.
- Avoid tight stops during high-spread periods.
Take Profit
- Set take profit levels based on realistic pip targets.
- Use pip value data to define reward-to-risk ratios.
- Allow more room for trades when spreads are low.
Practical Tips
- Use the candle timer to plan entries near candle close.
- Recheck the pip value when switching between currency pairs.
- This indicator is ideal for scalping and short-term trading.
MT4 Market Spread & Pip Value with Gann Trend Oscillator Forex Strategy
The MT4 Market Spread & Pip Value with Gann Trend Oscillator Strategy is a practical intraday trading method designed for traders who focus on precision and efficiency.
This setup combines the analytical data from the Forex Market Spread and Pip Value Indicator with the directional strength of the Gann Trend Oscillator MTF Indicator.
Together, these tools provide a clear understanding of market conditions, trade costs, and short-term momentum.
The Market Spread and Pip Value indicator displays key trading information directly on the chart, including the current spread, pip value per lot, and countdown to the next candle.
This helps traders select the best times to enter trades, avoiding periods of high spreads and illiquid conditions.
The Gann Trend Oscillator MTF Indicator complements it perfectly by identifying trend direction through color-coded histograms — blue for bullish signals and violet for bearish ones.
This strategy works best on the M1 and M5 timeframes, making it ideal for scalpers and short-term traders who aim to capture quick price movements across active currency pairs such as
USD/JPY, GBP/USD, and EUR/AUD.
Buy Entry Rules
- Confirm that the spread displayed by the Market Spread and Pip Value indicator is below 2 pips for major pairs or below 3 pips for crosses.
- Wait for the Gann Trend Oscillator histogram to turn blue, signaling bullish momentum.
- Ensure that the blue histogram appears after a brief consolidation or pullback.
- Enter a buy trade once the current candle closes with a confirmed blue histogram.
- Place the stop loss 5 to 10 pips below the most recent swing low.
- Take profit when the histogram starts to fade or turns violet.
Sell Entry Rules
- Check that the spread is low enough to maintain tight risk management (ideally below 2.5 pips).
- Wait for the Gann Trend Oscillator histogram to turn violet, showing bearish pressure.
- Confirm that price action is below a recent resistance or moving average level.
- Enter a sell trade once the candle closes with the violet histogram confirmed.
- Set a stop loss 5 to 10 pips above the last swing high.
- Take profit once the histogram begins to fade or turns blue.
Advantages
- Provides real-time spread and pip value information to optimize trade costs.
- Uses clear visual momentum confirmation through histogram color changes.
- Ideal for fast-moving intraday markets on M1 and M5 charts.
- Helps traders avoid poor entry conditions during volatile or thin markets.
- Simple and adaptable setup that suits all major and minor pairs.
Drawbacks
- High-spread conditions may limit trading opportunities.
- Short timeframes can generate false signals in choppy price zones.
- Requires constant monitoring of price action and spread changes.
Case Study 1: USD/JPY M1
During the Tokyo session, the Market Spread and Pip Value indicator showed a stable spread of 0.8 pips on USD/JPY.
The Gann Trend Oscillator turned blue at 151.26, confirming a short-term bullish push.
A buy trade was entered at 151.27 with a stop loss at 151.20 and a take profit at 151.40.
Within 10 minutes, the price reached the target for a +13 pip gain.
The low spread and clear momentum signal allowed for a precise and low-risk scalp.
Case Study 2: EUR/AUD M5
On the M5 chart during the London session, the Market Spread and Pip Value indicator displayed a spread of 1.5 pips.
After a short consolidation, the Gann Trend Oscillator turned violet at 1.6330, indicating renewed bearish momentum.
A sell trade was opened with a stop loss at 1.6350 and a target at 1.6295.
The move was completed within 45 minutes, generating a +35 pip profit.
The combination of a favorable spread and a clear oscillator signal helped capture the momentum phase effectively.
Strategy Tips
- Trade only when spreads are tight — this ensures better risk/reward outcomes.
- Use the pip value display to adjust lot size accurately and maintain consistent risk per trade.
- Avoid trading during news releases when spreads widen and momentum becomes erratic.
- Combine with candlestick confirmation (such as engulfing bars) to filter weak signals.
- Apply this strategy during the first two hours of major sessions for maximum efficiency.
- For improved accuracy, align the M5 and M15 Gann Trend directions when trading on M1.
Download Now
Download the “Market Value PipValue, Spread, Candle Close time.mq4” indicator for Metatrader 4
FAQ
Why is spread monitoring important?
Spread directly affects trade cost. Wider spreads reduce potential profit and increase risk, especially for short-term trades.
Does pip value change between currency pairs?
Yes. Pip value depends on the currency pair and lot size, which is why real-time calculation is important.
Is this indicator useful for scalpers?
Yes. Scalpers benefit from real-time spread data and candle timing to avoid poor execution.
Does the indicator affect MT4 performance?
No. It is lightweight and updates efficiently without slowing down the platform.
Summary
The Forex Market Spread and Pip Value MT4 indicator helps traders stay aware of trading costs and position sizing in real time.
By displaying spread, pip value per lot, and candle timing directly on the chart, it removes guesswork and speeds up decision-making.
With better cost awareness and accurate risk calculation, traders can improve consistency and overall trade management.


