
About the MACD with EMA Forex Signal Indicator
The MACD with EMA Forex Signal Indicator for MetaTrader 4 combines MACD momentum with an EMA filter to deliver precise trend signals.
It transforms market movement into easy-to-read colored bars.
Displayed in a separate sub-window, green bars show bullish momentum, while red bars indicate bearish momentum.
The EMA filter helps confirm the direction of the trend, improving signal reliability.
This indicator works well for intraday traders and scalpers who want quick entries based on clear trend momentum.
It can also be used as a filter to confirm other trading strategies.
Free Download
Download the “Macd-with-EMA.mq4” indicator for MT4
Key Features
- Colored trend histogram showing buy and sell signals
- Green bars signal upward momentum, red bars signal downward momentum
- EMA filter confirms the trend direction
- Easy-to-read sub-window display
- Helps reduce false signals in volatile markets
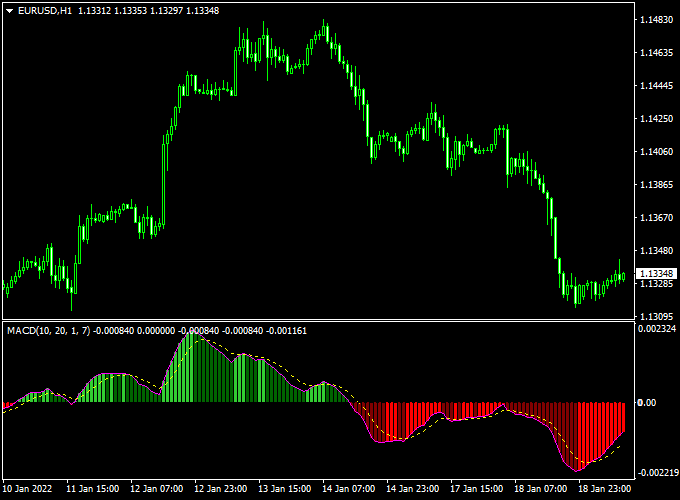
Indicator Chart
The chart below shows the MACD with EMA Forex Signal Indicator.
Green bars indicate bullish momentum, while red bars indicate bearish momentum.
The EMA filter helps confirm the trend and improve entry timing.
Guide to Trade with MACD with EMA Forex Signal Indicator
Buy Rules
- Wait for the first green bar above the 0.00 level
- Confirm the EMA is sloping upward
- Open a buy trade when momentum is sustained for a few bars
Sell Rules
- Wait for the first red bar below the 0.00 level
- Confirm the EMA is sloping downward
- Open a sell trade when downward momentum is confirmed for a few bars
Stop Loss
- Set stop loss just below the most recent swing low for buys
- Set stop loss just above the most recent swing high for sells
- Alternatively, use a multiple of the average bar size for dynamic stops
Take Profit
- Close trades when histogram bars change color
- Partial profits can be taken during strong trends
- Utilize a fixed pip target of your preference
Practical Tips
- Combine with higher timeframe trends to avoid counter-trend trades
- Focus on major sessions for clearer trend moves
- Wait for 2–3 consecutive bars to confirm momentum before entering
Day Trading Strategy: MACD with EMA Forex Signal Indicator & Sigma Bands (MT4)
This day trading strategy combines the MACD with EMA Forex Signal Indicator and the Sigma Bands Indicator on MetaTrader 4 (MT4) to identify high-probability buy and sell opportunities.
The MACD with EMA Forex Signal Indicator provides momentum insights, while the Sigma Bands Indicator offers trend-following signals.
This strategy is suitable for day trading on M15 and H1 timeframes and works well for pairs like AUD/JPY, EUR/GBP, and NZD/USD.
Buy Entry Rules
- Wait for the MACD with EMA Forex Signal Indicator to display a green histogram, indicating bullish momentum.
- Ensure the price is above the red middle Sigma Band and the bands are sloping upwards, confirming an uptrend.
- Enter a buy position when both conditions are met.
- Set a stop loss below the recent swing low or a fixed number of pips, depending on your risk tolerance.
- Set a take profit target at the next significant resistance level or use a risk-to-reward ratio of at least 1:2.
Sell Entry Rules
- Wait for the MACD with EMA Forex Signal Indicator to display a red histogram, indicating bearish momentum.
- Ensure the price is below the red middle Sigma Band and the bands are sloping downwards, confirming a downtrend.
- Enter a sell position when both conditions are met.
- Set a stop loss above the recent swing high or a fixed number of pips.
- Set a take profit target at the next significant support level or use a risk-to-reward ratio of at least 1:2.
Advantages
- Combines momentum and trend-following indicators for higher probability trades.
- Reduces market noise, allowing for clearer trade signals.
- Works effectively on M15 and H1 timeframes for day trading.
- Helps in identifying trend reversals and continuations with minimal lag.
- Flexible for different currency pairs with good liquidity.
Drawbacks
- Signals may be less reliable during low-volatility periods or consolidation phases.
- Requires constant chart observation to avoid missed entries or exits.
- Rapidly changing trends can produce false signals, leading to small losses.
Case Study 1: AUD/JPY M15 Buy
On the AUD/JPY M15 chart, the MACD with EMA Forex Signal Indicator displayed a green histogram, indicating bullish momentum.
The price was above the red middle Sigma Band, and the bands were sloping upwards, confirming an uptrend.
A buy position was entered at 88.50.
The stop loss was set at 88.30 (-20 pips), and the take profit target was 88.70 (+20 pips).
The price moved upward and hit the take profit level within the session, resulting in a +20 pip gain.
Case Study 2: NZD/USD H1 Sell
During the New York session on NZD/USD H1, the MACD with EMA Forex Signal Indicator displayed a red histogram, indicating bearish momentum.
The price was below the red middle Sigma Band, and the bands were sloping downwards, confirming a downtrend.
A sell position was entered at 0.6350.
The stop loss was set at 0.6365 (+15 pips), and the take profit target was 0.6325 (-25 pips).
The price declined steadily and reached the take profit level within the session, resulting in a +25 pips profit.
Strategy Tips
- Use M15 and H1 charts for day trading to capture intraday trends.
- Focus on major and liquid currency pairs like AUD/JPY, EUR/GBP, and NZD/USD.
- Apply proper risk management with stop losses and take profit targets.
- Combine with basic support and resistance levels to improve trade accuracy.
Download Now
Download the “Macd-with-EMA.mq4” indicator for Metatrader 4
FAQ
Can I combine this indicator with other oscillators?
Yes. It works well with RSI, Stochastic, or CCI to confirm momentum before entering a trade. Multiple confirmations can reduce false entries.
How do I know if a trend is weakening?
Watch for shorter green or red bars after a strong run. If the EMA slope flattens, the trend may be losing strength.
Does it repaint past signals?
No. Once a bar forms above or below 0.00, the signal is fixed. Historical bars remain unchanged for backtesting.
Can this indicator be used for scalping?
Yes. Its fast signal bars and EMA filter make it ideal for scalping, especially on M5 and M15 charts.
How do I set the best stop loss and take profit?
Consider recent bar lengths and average volatility. Align stops with swing points or support/resistance to avoid premature exits.
Summary
The MACD with EMA Forex Signal Indicator for MT4 turns MACD momentum into clear green and red bars, while the EMA filter confirms trend direction.
This combination allows traders to quickly identify trade entries and exits.
By combining these signals with support/resistance levels, proper risk management, and higher timeframe confirmation, traders can make timely, high-probability trades.


