
About the MACD with OsMA Forex Indicator
The MACD with OsMA Indicator for MetaTrader 4 is a technical tool designed to identify momentum shifts and generate precise buy and sell signals.
By combining the classic MACD with the OsMA (Oscillator of Moving Average), the indicator highlights changes in market activity and trend strength directly on the chart.
Signals are displayed as colored arrows, making it easy to spot potential entries at a glance.
A white arrow signals a buying opportunity, while a red arrow marks a potential sell.
The indicator is designed for scalpers and day traders who need clear, actionable information in real time.
By integrating OsMA, the indicator measures the difference between the MACD line and its signal line, enhancing traditional MACD signals and reducing noise.
This results in a cleaner signal system that can improve timing for both short-term and intraday trades.
Free Download
Download the “Macd osma on chart mtf.mq4” indicator for MT4
Key Features
- Generates buy and sell arrows directly on the main MT4 chart
- Uses MACD and OsMA to detect momentum shifts
- White arrows indicate buy signals, red arrows indicate sell signals
- Helps identify high-probability entries for scalping and intraday trading
Indicator Chart
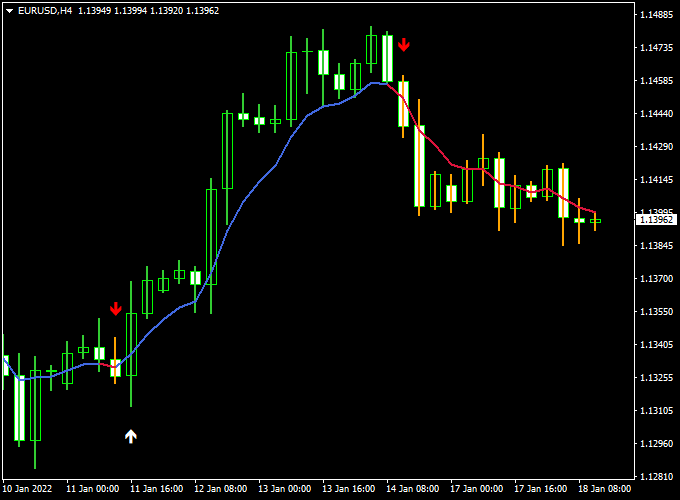
The chart below shows the MACD with OsMA Indicator in action.
White arrows mark potential buy entries when momentum shifts upward, and red arrows highlight sell opportunities when downward momentum increases.
Guide to Trade with MACD with OsMA Forex Indicator
Buy Rules
- Wait for a white arrow to appear on the chart
- Ensure the MACD signal line is trending upward
- Enter a buy trade at the open of the next candle
Sell Rules
- Wait for a red arrow to appear on the chart
- Confirm the MACD signal line is trending downward
- Enter a sell trade at the open of the next candle
Stop Loss
- Place stop loss slightly beyond the recent swing low for buy trades
- Place stop loss slightly beyond the recent swing high for sell trades
Take Profit
- Close the trade when the opposite arrow appears
- Partial profit-taking can be applied during strong trending conditions
Practical Tips
- Check the MACD signal line before entering a trade.
- Trade during the London and New York sessions for stronger moves.
- Use support and resistance to plan exits.
- Watch higher timeframes for trend direction.
- Manage risk with proper position sizing.
MACD with OSMA + Smoothed Hull MA Forex Scalping MT4 Strategy
This MT4 scalping strategy combines the MACD with OSMA Indicator and the Smoothed Hull Moving Average Indicator to catch short, high-probability trades on M1 and M5 charts.
The MACD with OSMA provides precise entry points using white (buy) and red (sell) arrows, while the Smoothed Hull MA shows the prevailing micro-trend with green (bullish) and orange (bearish) histogram bars.
Together, they filter out noise and deliver fast, trend-aligned scalping entries during active market hours.
Buy Entry Rules
- Wait for the Smoothed Hull MA to display green histogram bars, confirming an upward or bullish micro-trend.
- Look for a white arrow from the MACD with OSMA indicator to appear, indicating a buy entry signal.
- Enter a buy position at the close of the arrow candle or at the open of the next candle for confirmation.
- Set a stop loss just below the recent swing low or 5–8 pips below entry on M1 and 8–12 pips on M5.
- Take profit between 10–15 pips on M1 and 15–25 pips on M5, or close when orange histogram bars appear or a red arrow shows.
Sell Entry Rules
- Wait for the Smoothed Hull MA to display orange histogram bars, confirming a bearish micro-trend.
- Look for a red arrow from the MACD with OSMA indicator to appear, indicating a sell entry signal.
- Enter a sell trade at the close of the signal candle or the open of the next candle.
- Set the stop loss just above the recent swing high or 5–8 pips above the entry on M1 and 8–12 pips on M5.
- Set a take profit target of 10–15 pips on M1 and 15–25 pips on M5, or exit when green histogram bars or a white arrow appear.
Advantages
- Combines fast momentum signals with micro-trend direction for cleaner scalping entries.
- Visual and simple: white/red arrows for entry and green/orange histograms for confirmation.
- Works well in high-liquidity sessions (London and New York) where quick moves are common.
- Provides multiple opportunities daily with small, consistent profit targets.
Drawbacks
- In choppy or low-volatility periods, both indicators may give false signals and quick reversals.
- Requires fast execution and a broker with low spreads—slippage can ruin tight-stop trades.
- Because it’s a scalping setup, transaction costs can add up quickly on lower timeframes.
Case Study 1: GBPUSD M1 Buy Example
During the London session, GBPUSD showed green histogram bars on the Smoothed Hull MA around 1.2635.
Shortly after, the MACD with OSMA printed a white arrow at 1.2637.
A buy order was placed at 1.2638 with a stop loss at 1.2630 (-8 pips) and a target at 1.2652 (+14 pips).
Price moved upward within four minutes, hitting the target for a quick scalp.
The alignment of trend and momentum produced a clean, low-risk entry.
Case Study 2: USDJPY M5 Sell Example
In the early New York session, USDJPY printed orange histogram bars on the Smoothed Hull MA, showing a bearish bias.
Soon after, a red arrow appeared from the MACD with OSMA at 150.85.
A sell trade was opened at 150.83 with a stop loss at 150.95 (-12 pips) and a take profit at 150.60 (+23 pips).
Price dropped steadily, reaching the profit target in about 20 minutes, confirming how strong alignment between both indicators yields efficient short-term trades.
Strategy Tips
- Focus on major pairs such as EURUSD, GBPUSD, and USDJPY with tight spreads and high intraday volume.
- Avoid trading around major news events or low-liquidity hours—signals are less reliable when volatility is erratic.
- Only take trades when both indicators align perfectly; mismatched colors or early arrows usually lead to losses.
- Use this strategy on M1 or M5 charts only during active market hours for optimal precision.
- Keep risk small (0.5–1% per trade) since multiple scalps per day will naturally compound results.
Download Now
Download the “Macd osma on chart mtf.mq4” indicator for Metatrader 4
FAQ
How does the OsMA improve MACD signals?
OsMA measures the difference between the MACD line and its signal line, providing additional confirmation of momentum changes.
This helps filter out weaker MACD signals and reduces false entries.
What timeframe works best?
The indicator is flexible but performs best on M15, M30, and H1 charts for intraday trading.
Shorter timeframes are useful for scalping, while higher timeframes provide more stable trend signals.
Can this indicator be used across multiple currency pairs?
Yes. It works consistently across major and minor pairs.
Signals adapt to each pair’s volatility and trend, making it suitable for traders monitoring several markets at once.
Summary
The MACD with OsMA Indicator for MT4 combines momentum analysis with the OsMA oscillator to deliver precise buy and sell arrows directly on the chart.
White arrows indicate bullish momentum, while red arrows signal potential selling opportunities.
Its integration of MACD and OsMA provides clearer signals, reduces noise, and helps traders identify high-probability entries for scalping and intraday trading.
When combined with proper risk management and confirmation from price action, this indicator can improve timing, reduce false trades, and support faster decision-making in active markets.


