
About the MACD on RSI Forex Indicator
The MACD on RSI Indicator for MetaTrader 4 is a technical tool designed for intraday traders and scalpers.
It combines the momentum-measuring power of the MACD with the relative strength information from RSI, presenting signals in a dedicated subwindow of your MT4 platform.
The indicator displays a color-coded histogram, along with two overlay lines, helping traders spot potential entry points as the momentum shifts.
Red bars highlight the main trading trend, while the lines provide additional confirmation for trade timing.
By using both MACD and RSI together, this indicator offers a refined view of market strength and momentum.
It is especially effective for short-term trading strategies, enabling faster reaction to price reversals and intraday trends.
Free Download
Download the “Macd on rsi.mq4” indicator for MT4
Key Features
- Red histogram showing buy and sell momentum
- Two overlay lines provide additional confirmation
- Displays signals in a bottom MT4 window for clean charting
- Optimized for scalping and intraday trading
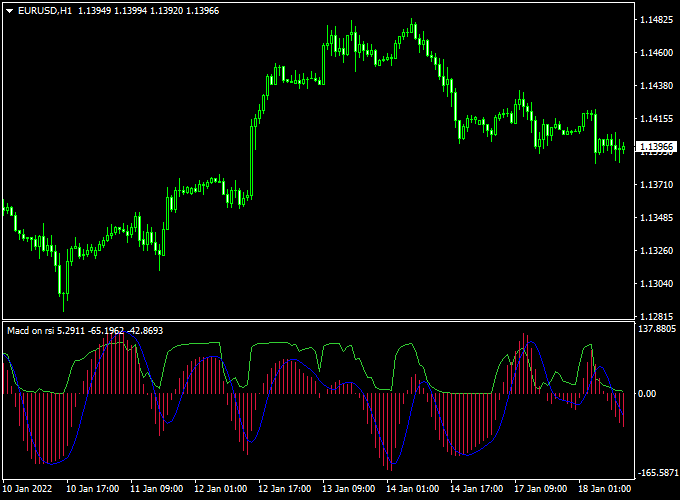
Indicator Chart
The chart below illustrates the MACD on RSI Indicator in action.
Red histogram bars appear when momentum is shifting, while the overlay lines help identify confirmation points.
The combination allows traders to detect high-probability buy and sell setups quickly.
Guide to Trade with MACD on RSI Forex Indicator
Buy Rules
- Wait for the first red histogram bar to cross the 0.00 level from bottom to top
- Confirm that the overlay lines support upward momentum
Sell Rules
- Wait for the first red histogram bar to cross the 0.00 level from top to bottom
- Check that the overlay lines indicate downward pressure
Stop Loss
- Set stop loss just beyond the recent swing high for sell trades
- Set stop loss just beyond the recent swing low for buy trades
- This approach adapts to the current price movement and intraday volatility
Take Profit
- Target the nearest intraday support or resistance level
- Close the trade if an opposite histogram signal appears
- Partial profit-taking can be considered during strong momentum moves
Practical Tips
- Use the indicator on M5, M15, or M30 charts for scalping and intraday trades
- Combine histogram signals with support/resistance for better trade timing
MACD on RSI + Keltner Channel-Signals MT4 Day Trading Strategy
This intraday trading strategy uses two well-defined indicators: the MACD on RSI Indicator for MT4, where a red histogram above 0 signals a buy and below 0 signals a sell.
The Keltner Channel with Signals Indicator for MT4, where a blue star signals a bullish trend and a brown star signals a bearish trend.
This strategy is tailored for intraday trading—especially on M15 and H1 charts—on major currency pairs during active sessions.
It relies on the alignment of momentum (via MACD on RSI) and trend strength/volatility (via Keltner Channel signals).
Good for traders who monitor the charts and look for well‐filtered entries.
Buy Entry Rules
- Confirm that the MACD on RSI histogram has turned red and moved above zero, which signals bullish momentum.
- Then check that the Keltner Channel with Signals indicator has displayed a blue star, confirming a bullish trend/volatility condition.
- Enter a buy trade at the close of the signal candle (or at the open of the next candle if you prefer a confirmation buffer).
- Place the stop loss just below the recent swing low (or below the lower band of the Keltner channel if appropriate) to give room for intraday movement.
- Set the take profit at a risk-to-reward ratio of at least 1:1.5—for example, if your stop is 20 pips, aim for ~30 pips.
- Or exit when the histogram drops back below zero or the Keltner indicator produces a brown star (trend flip), whichever occurs first.
Sell Entry Rules
- Confirm that the MACD on RSI histogram has fallen below zero, signaling bearish momentum.
- Then check that the Keltner Channel with Signals indicator shows a brown star, indicating a bearish trend/volatility condition.
- Enter a sell trade at the close of the signal candle (or at the next candle open for safety).
- Place the stop loss just above the recent swing high or above the upper band of the Keltner channel, depending on volatility.
- Set take profit similarly to the buy side—risk of e.g. 20 pips and aim for ~30 pips.
- Or exit when the histogram rises above zero or a blue star appears on the Keltner indicator signaling a trend change.
Advantages
- Combines momentum (MACD on RSI) with trend/volatility confirmation (Keltner Channel signals), which helps filter out weaker setups.
- Clear visual cues: red histogram above zero (buy momentum) / below (sell); blue star (bullish trend) / brown star (bearish trend). Makes entries more straightforward.
- Works well during active intraday sessions when volatility and trend direction are present—not just random sideways movement.
- Defined risk-reward and stop loss rules help maintain discipline in intraday trading, where many trades are taken.
Drawbacks
- Because this is intraday and the signals often give small to moderate targets, spreads, execution speed, and slippage matter a lot. Poor execution will erode profits.
- The indicator signals will have some lag (momentum and trend confirmation both need time), so you may enter after part of the move has already occurred, reducing potential target size.
Case Study 1: EURCAD M15 Buy Setup
During the European session on the EURCAD pair, the MACD on RSI histogram turned red and moved above zero at 1.3750.
Shortly afterward, the Keltner Channel with Signals indicator produced a blue star.
A buy trade was entered at 1.3752 with a stop loss at 1.3732 (20 pips risk) and a take profit set at 1.3782 (~30 pips target).
The pair moved in line with the trend and hit the target within about 50 minutes, yielding +30 pips.
The alignment of momentum and trend provided a strong intraday entry.
Case Study 2: USDCHF H1 Sell Setup
On the USDCHF pair during the London-New York overlap, the histogram from MACD on RSI dropped below zero at 0.9535, signaling bearish momentum.
Soon after, the Keltner Channel indicator showed a brown star.
A sell order was placed at 0.9533 with a stop loss at 0.9553 (+20 pips risk) and take profit at 0.9503 (~−30 pips target).
Within about 75 minutes, the pair moved down and reached the target, giving +30 pips.
The dual confirmation of the momentum drop and trend flip helped filter the strong move.
Strategy Tips
- Focus on major and liquid currency pairs such as EURUSD, GBPUSD, USDCHF, and EURCAD. These tend to provide cleaner signals and tighter spreads.
- Avoid taking trades immediately before major economic news releases—volatility might spike, signals may generate early or false entries, and risk is higher.
- Use this strategy during active intraday sessions (e.g., European session, London–New York overlap) when market participants are plentiful and moves are stronger.
- Stick to small risk per trade (e.g., 0.5–1% of account) because you may take multiple trades per day; preserving capital is crucial.
Download Now
Download the “Macd on rsi.mq4” indicator for Metatrader 4
FAQ
What does the histogram actually measure?
The histogram represents the difference between the MACD on the RSI and its signal line.
It shows the strength and direction of short-term momentum, helping traders identify when bullish or bearish pressure is increasing.
Why are the overlay lines important?
The blue and red lines around the histogram act as a confirmation tool.
They show the trend direction and can help filter out weak signals, giving traders more confidence before entering a trade.
Can this indicator be used in sideways markets?
Yes, but signals may be less reliable.
During low-volatility or sideways periods, the histogram can fluctuate around the zero line without a clear trend, so it’s best to wait for a confirmed breakout or strong momentum.
How can I combine this indicator with other tools?
Many traders combine MACD on RSI with support and resistance levels, price action patterns, or moving averages.
Doing so can improve entry timing and reduce the risk of false trades.
Does it repaint or adjust past signals?
No. Once a histogram bar or crossover appears, it stays fixed. This allows traders to trust historical signals for analysis and backtesting.
Summary
The MACD on RSI Indicator for MT4 merges momentum and relative strength analysis into a single, practical tool.
Red histogram bars and overlay lines provide clear buy and sell signals, making it ideal for scalping and day trading.
By combining MACD and RSI logic, the indicator filters out weaker setups and highlights more reliable entries.
When used with proper stop loss management, session timing, and intraday support/resistance, it helps traders act quickly on momentum shifts while reducing the risk of false signals.


