
About the MACD 3 TF NRP Forex Indicator
The MACD 3 TF NRP indicator for MT4 provides clear buy and sell signals in a dedicated sub-window.
It combines MACD logic with multiple timeframe analysis, allowing traders to see trend changes across three timeframes at once.
A buy signal occurs when the histogram bars move back above the 0.00 neutral level, while a sell signal appears when the bars move back below 0.00.
The indicator is non-repainting, giving traders confidence that signals remain valid after they appear.
It is suitable for all currency pairs and trading styles, from scalping to intraday and swing trading.
The multi-timeframe perspective helps filter out weak signals and identify stronger trend opportunities.
Free Download
Download the “macd 3 tf nrp.mq4” indicator for MT4
Key Features
- Multi-timeframe MACD histogram for more reliable signals
- Signals a buy when bars cross above the 0.00 level, sell when below
- Non-repainting, giving consistent historical signals
- Appears in a separate MT4 sub-window for easy monitoring
Indicator Chart
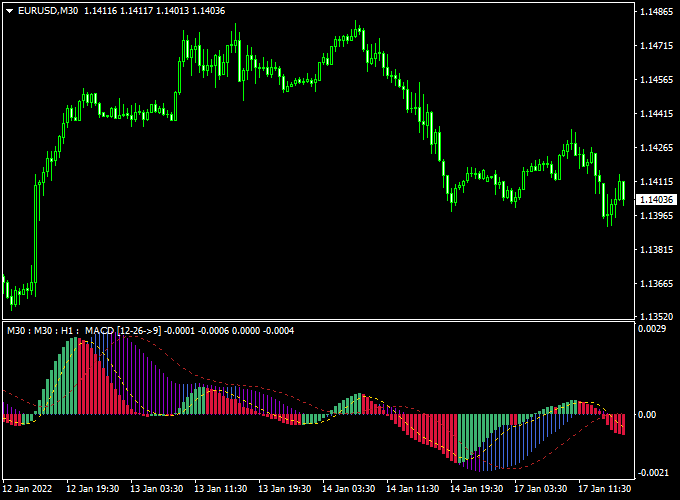
The MACD 3 TF NRP chart displays histogram bars in a sub-window below the main price chart.
Green bars above 0.00 indicate bullish momentum and potential buy trades, while red bars below 0.00 indicate bearish momentum and potential sell trades.
The multi-timeframe approach helps confirm trend strength and reduces false entries.
Guide to Trade with MACD 3 TF NRP Indicator
Buy Rules
- Enter a buy trade when histogram bars cross above the 0.00 level
- Confirm that higher timeframe bars are also bullish for stronger signals
- Wait for the candle close that aligns with the histogram direction
Sell Rules
- Enter a sell trade when histogram bars cross below the 0.00 level
- Confirm that higher timeframe bars are bearish
- Wait for the candle close to validate the bearish momentum
Stop Loss
- Place below the nearest minor swing low for buy trades
- Place above the nearest minor swing high for sell trades
- Consider trailing stops after partial profits to protect gains
Take Profit
- Close part of the trade when histogram bars begin to weaken
- Let the remaining position run until opposite signals appear
- Use recent swing highs or lows as exit points
- Consider a trailing stop to capture extended trends
Practical Tips
- Use the indicator alongside trend confirmation from higher timeframes
- Avoid entering trades when histogram bars are small or inconsistent
- Be cautious during sudden news spikes, as momentum can change rapidly
MACD 3 TF NRP + AG Renko Chart Forex Day Trading Strategy
This day trading strategy combines the MACD 3 TF NRP Forex Indicator for MT4 with the AG Renko Chart Metatrader 4 Forex Indicator.
The MACD 3 TF NRP indicator generates buy signals when the histogram crosses above zero and sell signals when it crosses below.
The AG Renko Chart shows blue Renko lines for bullish trends and red Renko lines for bearish trends.
By combining these two indicators, traders can identify trend direction and enter high-probability intraday trades aligned with momentum.
Why this strategy works
This strategy works by aligning trend and momentum signals to filter out market noise.
The MACD 3 TF NRP identifies shifts in momentum, while the AG Renko Chart confirms the prevailing trend visually.
Using both together helps traders avoid countertrend entries and increases the probability of successful intraday trades.
Buy Entry Rules
- Wait for the MACD 3 TF NRP histogram to cross above zero.
- Confirm that the AG Renko Chart displays a blue Renko line.
- Enter a buy trade at the open of the next candle after both conditions are met.
- Place the stop loss below the most recent swing low or below the Renko support.
- Set the take profit near the next resistance level or use a 1:2 risk-reward ratio.
- Exit early if the MACD histogram crosses below zero or the Renko line turns red.
Sell Entry Rules
- Wait for the MACD 3 TF NRP histogram to cross below zero.
- Confirm that the AG Renko Chart displays a red Renko line.
- Enter a sell trade at the open of the next candle after both conditions are met.
- Place the stop loss above the most recent swing high or above the Renko resistance.
- Set the take profit near the next support level or use a 1:2 risk-reward ratio.
- Exit early if the MACD histogram crosses above zero or the Renko line turns blue.
Advantages
- Combines momentum and trend confirmation for higher-probability trades.
- Renko charts filter out market noise, making trend direction clearer.
- Visual signals allow quick identification of entries and exits.
- Works well on M15 and H1 charts for intraday trading.
- Structured stop loss and take profit guidelines help manage risk effectively.
Drawbacks
- Signals may lag during sudden trend reversals.
- False entries can occur in low-volatility or ranging markets.
- Renko charts may be less effective on low-liquidity pairs.
Case Study 1 – EUR/CHF H1
During the London session, EUR/CHF showed a blue Renko line while the MACD 3 TF NRP histogram crossed above zero.
A buy trade was entered at 1.0740 with a stop loss at 1.0728 and a take profit at 1.0760.
The trade reached the target in 90 minutes, producing a 20-pip gain.
Case Study 2 – AUD/CAD H1
During the New York session, AUD/CAD showed a red Renko line while the MACD 3 TF NRP histogram crossed below zero.
A sell trade was entered at 0.9125 with a stop loss at 0.9140 and a take profit at 0.9105.
The trade reached the take profit in 2 hours, resulting in a 20-pip gain.
Strategy Tips
- Use M15 or H1 charts to capture intraday trends efficiently.
- Focus on liquid pairs like EUR/CHF, AUD/CAD, GBP/USD, and EUR/USD for tighter spreads.
- Adjust stop loss and take profit according to session volatility.
- Consider only taking trades in the direction of major market sessions for higher reliability.
- Monitor momentum and trend alignment closely to avoid trading during sideways markets.
Download Now
Download the “macd 3 tf nrp.mq4” indicator for Metatrader 4
FAQ
How does the multi-timeframe approach improve signals?
By observing three different timeframes at once, the indicator filters out weak signals and highlights stronger trends.
This makes it easier to avoid entering trades during short-term noise.
Can I combine this with other indicators?
Yes. It works well alongside moving averages, trend filters, or support/resistance levels to enhance accuracy.
What should I do if the histogram bars flatten?
Flat bars indicate indecision or low momentum.
It’s best to wait until the bars show a clear movement above or below the 0.00 level before entering a trade.
Is it suitable for volatile market conditions?
Yes, but traders should use slightly wider stop losses and monitor trades carefully.
High volatility can produce faster signals, so adjust risk management accordingly.
Summary
The MACD 3 TF NRP Forex indicator for MT4 is a versatile tool for identifying trend direction and momentum across multiple timeframes.
Its non-repainting histogram bars provide reliable buy and sell signals, helping traders make informed decisions with confidence.
By combining trend analysis from three timeframes, the indicator filters out weak signals and highlights stronger trading opportunities.
It can be used as a standalone system or alongside other strategies to improve accuracy.


