
About the Moving Average 3 Color Indicator
The Moving Average 3 Color Indicator for MT4 is a trend-following tool that uses a triple-colored moving average to highlight market direction.
It helps traders quickly identify bullish, bearish, and neutral conditions without complex analysis.
Green lines indicate upward momentum, red lines signal downward pressure, and yellow lines show sideways or consolidating market conditions.
This makes it easy to determine when to enter, exit, or hold a trade.
The indicator can be used as a standalone trading tool or combined with other strategies as a trend confirmation filter.
Its simplicity makes it beginner-friendly, while the clear color-coded signals remain valuable for experienced traders managing multiple pairs or timeframes.
Free Download
Download the “ma 3 color.mq4” indicator for MT4
Key Features
- Triple-colored moving average for trend direction
- The green line signals buy opportunities, the red line signals sell opportunities, yellow line indicates consolidation
- Can be used for entries, exits, or as a trend filter
- Works on multiple timeframes and currency pairs
- Simple and beginner-friendly design
- Helps quickly assess short-term and medium-term trends
Indicator Chart
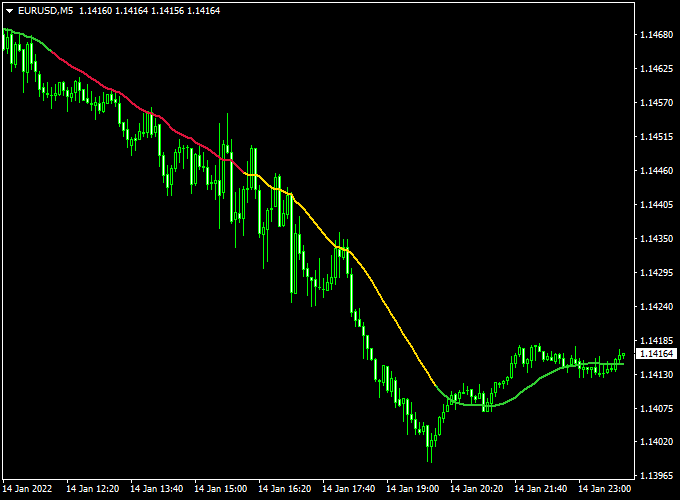
The chart below shows the Moving Average 3 Color Indicator applied to an MT4 chart.
Green lines appear during bullish trends, red lines indicate bearish trends, and yellow lines show sideways movement.
Traders can use these visual signals to time their entries, exits, and when to hold trades.
Guide to Trade with Moving Average 3 Color Indicator
Buy Rules
- Open a buy trade when the indicator starts drawing the green line
- Enter at the opening of the next candle
Sell Rules
- Open a sell trade when the indicator starts drawing the red line
- Enter at the opening of the next candle
Hold Rules
- Stick with the open trade when the indicator starts drawing the yellow line
- Wait for the next green or red line to appear before considering new entries
Stop Loss
- For buy trades, place a stop loss just below the last point where the line turned green
- For sell trades, place a stop loss just above the last point where the line turned red
- Adjust the distance slightly based on market volatility to avoid premature exits
Take Profit
- Close trades when the indicator changes color or an opposite line appears
- Optional: target recent swing highs or lows for partial profit
Practical Tips
- The yellow line can be used to avoid entering trades in consolidating markets
- Combine with other trend indicators for stronger confirmation
- Monitor multiple currency pairs to catch trending opportunities
Moving Average 3 Color & Lucky Reversal Indicator MT4 Day Trading Strategy
This MT4 day trading strategy combines the Moving Average 3 Color Indicator and the Lucky Reversal Indicator to identify high-probability intraday trades.
The Moving Average 3 Color Indicator shows trend direction: green line for bullish trend and red line for bearish trend.
The Lucky Reversal Indicator provides blue arrows for bullish reversal signals and red arrows for bearish reversal signals.
This strategy is designed for 15-minute and 30-minute charts and works well on major currency pairs like EUR/USD, GBP/USD, and AUD/USD.
Buy Entry Rules
- Ensure the Moving Average 3 Color line is green, confirming a bullish trend.
- Wait for a blue arrow from the Lucky Reversal Indicator, signaling a bullish reversal.
- Enter a buy trade immediately after the blue arrow appears in alignment with the green line.
- Place a stop loss below the most recent swing low.
- Set a take profit target of 20–35 pips or at the next significant resistance level.
- Close the trade immediately if the Lucky Reversal arrow turns red or the MA line turns red.
Sell Entry Rules
- Ensure the Moving Average 3 Color line is red, confirming a bearish trend.
- Wait for a red arrow from the Lucky Reversal Indicator, signaling a bearish reversal.
- Enter a sell trade immediately after the red arrow appears in alignment with the red line.
- Place a stop loss above the most recent swing high.
- Set a take profit target of 20–35 pips or at the next significant support level.
- Close the trade immediately if the Lucky Reversal arrow turns blue or the MA line turns green.
Advantages
- Combines trend direction with reversal signals for higher accuracy.
- Works well on 15-minute and 30-minute intraday charts.
- Visual arrows and colored trend lines make entries and exits clear.
- Captures significant intraday price movements efficiently.
- Suitable for major currency pairs like EUR/USD, GBP/USD, and AUD/USD.
Other Drawbacks
- Signals may lag slightly during sudden trend reversals due to the moving average calculation.
- Frequent signals in volatile markets can lead to overtrading if not disciplined.
- In flat or low-volatility markets, the strategy may generate false entries, reducing the win rate.
- May perform differently across currency pairs; optimization may be needed for exotic pairs.
Case Study 1: EUR/USD 15-Minute Chart
The Moving Average 3 Color line was green, indicating a bullish trend.
A blue arrow appeared on the Lucky Reversal Indicator, signaling a buy.
A buy trade was entered with a stop loss below the recent swing low and a take profit at 25 pips.
The trade reached the target, and the position was closed when the Lucky Reversal arrow turned red.
Case Study 2: GBP/USD 30-Minute Chart
The Moving Average 3 Color line was red, showing a bearish trend.
A red arrow appeared on the Lucky Reversal Indicator, signaling a sell.
A sell trade was entered with a stop loss above the recent swing high and a take profit at 30 pips.
The trade hit the target, and the position was closed when the MA line turned green.
Strategy Tips
- Use a small position size initially to test the strategy on your preferred currency pairs.
- Monitor key support and resistance levels to filter entries and improve risk/reward ratio.
- Consider using a trailing stop to lock in profits on longer intraday moves.
- Avoid trading during major news releases to reduce the risk of slippage and false signals.
- Focus on the most active trading sessions, such as London and New York, for tighter spreads and better execution.
Download Now
Download the “ma 3 color.mq4” indicator for Metatrader 4
FAQ
How should I interpret the yellow line?
The yellow line signals a neutral or sideways market. Traders can hold existing trades or wait for the next green or red line before entering new positions.
Can I use this indicator for multiple currency pairs at the same time?
Yes, the color-coded signals make it easy to monitor several pairs at once, helping you quickly spot trending opportunities without complex analysis.
Can I combine it with other indicators?
Absolutely. Many traders use it alongside momentum or oscillators to confirm trade entries or exits and reduce false signals.
Summary
The Moving Average 3 Color Indicator for MT4 provides a simple and effective way to identify market trends using green, red, and yellow lines.
It allows traders to enter, exit, and hold trades based on clear directional signals.
Its beginner-friendly design also makes it useful for experienced traders seeking fast trend confirmation.
When combined with other indicators or strategies, it can improve trade timing, reduce false entries, and increase confidence in decision-making.


