About the Kaufman Forex Signal Indicator
The Kaufman Forex Signal Indicator for Metatrader 4 provides clear, real-time buy and sell signals directly on the chart.
It is designed for traders who want simple, actionable guidance without needing to interpret multiple indicators.
The indicator plots colored dots on the main MT4 chart to signal potential entry points.
Blue dots indicate bullish opportunities, while yellow dots signal potential bearish moves.
This setup allows traders to make fast decisions aligned with the current market trend.
It can be used as a standalone system for both trade entries and exits or as a confirming tool alongside other trend-following strategies.
The indicator works across multiple timeframes and currency pairs, making it suitable for scalping, intraday, and swing trading styles.
Free Download
Download the “Kaufman.mq4” indicator for MT4
Key Features
- Real-time buy and sell signal dots are plotted directly on the chart
- Works as a standalone system or as a trend-following filter
- Supports multiple timeframes and instruments
- Easy-to-read signals for fast trading decisions
- Reduces guesswork for entry and exit timing
- Compatible with any existing trading strategy
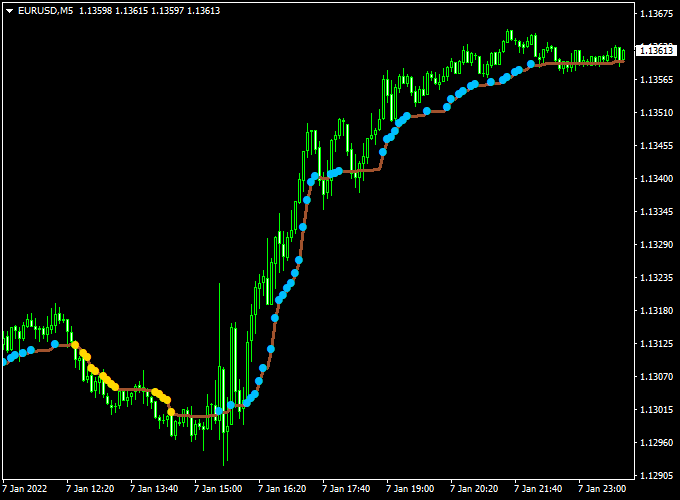
Indicator Chart
The chart shows the Kaufman Forex Signal Indicator with blue and yellow dots plotted above and below candlesticks.
Blue dots suggest a bullish entry, while yellow dots indicate bearish momentum.
This simple visual makes it easy to align trades with prevailing market conditions.

Guide to Trade with Kaufman Forex Signal Indicator
Buy Rules
- Enter a buy trade as soon as the first blue dot appears.
- Confirm the dot appears after a small pullback for better timing.
Sell Rules
- Enter a sell trade as soon as the first yellow dot appears.
- Ensure the dot is not immediately after a sharp spike to reduce false signals.
Stop Loss
- For buy trades, place the stop loss slightly below the low of the candle that triggered the blue dot.
- For sell trades, place the stop loss slightly above the high of the candle that triggered the yellow dot.
- Alternatively, use the ATR (Average True Range) of the last 5 candles to set a dynamic stop based on current volatility.
- Ensure the stop allows some room for normal retracements, avoiding premature exits.
Take Profit
- Set the first target at the next visible support or resistance zone on the chart.
- Consider trailing the stop behind each successive dot in the direction of the trend to lock in profits.
- Exit trades if an opposite color dot appears or if momentum starts to weaken.
Practical Tips
- Use higher timeframes to determine overall trend direction and lower timeframes for entries.
- Focus on one or two currency pairs initially to understand the indicator’s behavior.
Kaufman + XP Moving Average MT4 Day Trading Strategy
This MT4 strategy combines the Kaufman Forex Signal indicator and the XP Moving Average indicator to create a clean and reliable day trading setup.
The Kaufman indicator identifies the main market direction, showing blue dots for bullish conditions and yellow dots for bearish ones.
The XP Moving Average provides precise entry signals with a green line for buy and a red line for sell.
The logic behind this strategy is simple. The Kaufman indicator filters the overall trend, while the XP Moving Average identifies short-term timing opportunities.
By aligning both, traders focus on higher probability setups and avoid trading against the prevailing market sentiment.
The method performs best on M5, M15, and H1 charts during active sessions like London and New York.
It suits traders who prefer clarity and consistency over complicated systems.
Buy Entry Rules
- Wait until the Kaufman indicator displays blue dots, showing an active bullish trend.
- Confirm that the XP Moving Average line turns green and slopes upward.
- Enter a buy trade at the candle close after the green confirmation.
- Place a stop loss a few pips below the most recent swing low.
- Set take profit at 1.5x to 2x the stop loss distance or trail the stop to capture extended moves.
Sell Entry Rules
- Wait until the Kaufman indicator displays yellow dots, showing a bearish trend.
- Confirm that the XP Moving Average line turns red and slopes downward.
- Enter a sell trade at the candle close after the red confirmation.
- Place a stop loss a few pips above the most recent swing high.
- Set take profit at 1.5x to 2x the stop loss distance, or use a trailing stop when the move extends strongly.
Advantages
- Simple structure suitable for all experience levels.
- Combines a trend filter and a timing tool for more accurate entries.
- Reduces emotional decision-making during volatile sessions.
- Adaptable to multiple forex pairs and timeframes.
- Easy to automate with alerts or scripts.
Drawbacks
- False signals can appear during sideways market phases.
- Lagging effect from moving averages may reduce reward potential.
- Requires consistent risk management to maintain profit stability.
- Performance depends on session volatility and pair behavior.
Case Study 1 – EURUSD M15 London Session
During the London open, EURUSD formed a steady bullish channel.
The Kaufman indicator printed blue dots for over an hour, confirming upward momentum.
When the XP Moving Average turned green, a long position was opened.
The stop loss was set 20 pips below the entry, and the take profit aimed for 40 pips.
Within 90 minutes, the price reached the target with a clean structure and minimal drawdown.
The alignment of both indicators filtered out false reversals and kept focus on the main intraday trend.
The strategy achieved a 2:1 risk-to-reward ratio with clear exit management.
Case Study 2 – USDJPY M5 New York Session
In the New York afternoon, USDJPY began consolidating before breaking lower.
The Kaufman indicator shifted from blue to yellow dots, signaling a potential bearish trend.
The XP Moving Average turned red soon after, confirming a sell setup.
The trade was executed with a 15-pip stop loss and a 30-pip take profit.
The pair dropped sharply within half an hour and hit the target quickly.
The trailing stop locked in an extra 10 pips as the price continued downward.
The example highlights how both indicators confirm momentum, reducing hesitation and improving timing accuracy.
Strategy Tips
- Trade during major sessions with enough volatility for clean signals.
- Avoid trading in very flat markets where both indicators frequently change color.
- Adjust stop loss and take profit to match each currency pair’s volatility.
- Keep risk per trade low while you test and adapt the system.
- Use a trailing stop or partial profit booking to capture extended intraday moves.
- Always confirm that both indicators align before entering a trade.
This Kaufman + XP Moving Average MT4 strategy helps traders find directional setups with better accuracy.
It filters noise, provides structured entries, and maintains consistent results when applied with discipline.
For best performance, stick to active trading hours and manage each position carefully.
Download Now
Download the “Kaufman.mq4” indicator for Metatrader 4
FAQ
Can the Kaufman Forex Signal Indicator be used alone?
Yes, it provides both entry and exit signals and can function as a standalone system for intraday or swing trading.
Which timeframes are most effective?
The indicator works on all timeframes, but M15 to H1 often offer a good balance between signal frequency and reliability.
Can it be combined with other indicators?
Yes, it works well with trend-following tools or oscillators to confirm entries and filter out low-probability signals.
Summary
The Kaufman Forex Signal Indicator for MT4 delivers easy-to-follow real-time buy and sell signals using colored dots.
Its simple visual signals allow traders to make confident entry and exit decisions without overcomplicating analysis.
The indicator is flexible, suitable for multiple trading styles, and can be integrated into larger strategies for improved trade selection.
Combining it with trend or momentum confirmation tools can further enhance reliability and timing.


