About the KAMA Forex Trend Indicator
The KAMA Forex Trend Indicator for Metatrader 4 is designed to follow the dominant market direction using a custom-built adaptive moving average.
Unlike classic moving averages, KAMA adjusts its sensitivity based on market volatility, allowing it to react faster during strong trends and slow down during ranging conditions.
This adaptive behavior makes the indicator especially useful for traders who want to stay in trending moves without being shaken out by minor pullbacks.
The indicator is plotted directly in the main MT4 chart window as a thick red signal line, making trend direction easy to read at a glance.
Free Download
Download the “KAMA.mq4” indicator for MT4
Key Features
- An adaptive moving average that responds to changing volatility
- Helps identify the dominant market trend
- Displayed directly in the main MT4 chart window
- Red thick signal line for quick visual interpretation
- Customizable KAMA period for different trading styles
Indicator Chart
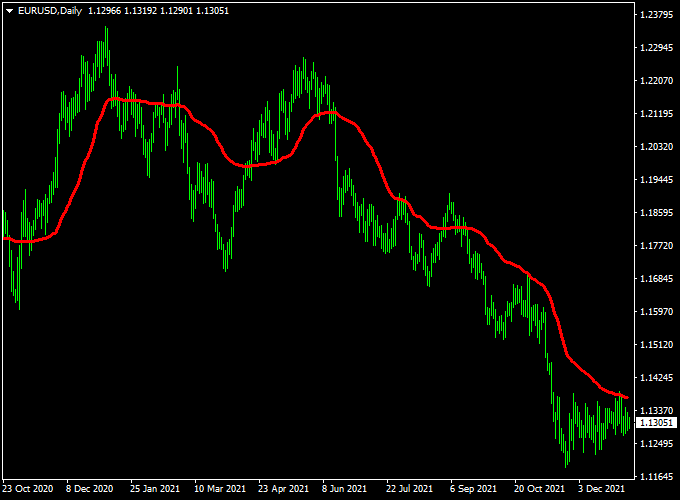
The chart below shows the KAMA Forex Trend Indicator applied to a price chart.
The red KAMA signal line follows the market direction, with price closing above the line during bullish phases and below it during bearish phases.
This visual layout helps traders stay aligned with the prevailing trend and avoid counter-trend entries.

Guide to Trade with KAMA Forex Trend Indicator
Buy Rules
- Wait for a candlestick to close above the red KAMA signal line.
- Confirm that the candle body closes fully above the line.
- Open a buy trade at the start of the next candle.
Sell Rules
- Wait for a candlestick to close below the red KAMA signal line.
- Ensure the close is decisive and not caused by a short spike.
- Open a sell trade at the start of the next candle.
Stop Loss
- Place the stop loss below the most recent swing low for buy trades.
- For sell trades, set the stop loss above the most recent swing high.
- Allow enough room for normal pullbacks around the KAMA line.
Take Profit
- Target the next visible support or resistance level.
- Use a trailing stop that follows the KAMA line during strong trends.
- Consider scaling out part of the position as momentum slows.
Practical Tips
- Use higher timeframes to define the main trend and lower ones for entries.
- Avoid trading when price repeatedly crosses the KAMA line in short succession.
- Adjust the KAMA period based on market conditions and trading style.
KAMA + XMaster Formula MT4 Scalping Strategy
This MT4 scalping strategy combines the KAMA Forex Trend Indicator and the XMaster Formula MT4 Indicator to identify high-probability intraday trades.
The KAMA indicator determines the prevailing market trend, while the XMaster Formula provides precise entry signals with its yellow arrows.
This combination works well on M1, M5, and M15 timeframes, making it ideal for active scalpers who want to capture short-term price movements with minimal risk.
Buy Entry Rules
- Confirm that the KAMA line is above the red baseline, indicating a bullish trend.
- Wait for a yellow up arrow from the XMaster Formula, signaling a buy opportunity.
- Enter a buy trade at the close of the candle with the yellow arrow.
- Place a stop loss below the most recent swing low or 10–15 pips below the entry for M1/M5 charts.
- Set a take profit at 15–30 pips for M1, 25–50 pips for M5, or use a trailing stop to follow momentum.
Sell Entry Rules
- Confirm that the KAMA line is below the red baseline, indicating a bearish trend.
- Wait for a yellow down arrow from the XMaster Formula, signaling a sell opportunity.
- Enter a sell trade at the close of the candle with the yellow arrow.
- Place a stop loss above the most recent swing high or 10–15 pips above the entry for M1/M5 charts.
- Set a take profit at 15–30 pips for M1, 25–50 pips for M5, or use a trailing stop to maximize profits.
Advantages
- Provides clear trend direction with the KAMA indicator to avoid countertrend trades.
- XMaster Formula signals give precise buy and sell entry points, reducing hesitation.
- Suitable for multiple timeframes, offering flexibility for scalpers.
- Helps manage risk with defined stop loss and take profit levels.
- Combining trend and signal indicators improves trade accuracy and consistency.
Drawbacks
- Frequent trades on lower timeframes can lead to small losses if spreads are high.
- False signals may occur during sideways or choppy market conditions.
- Requires discipline and strict adherence to stop loss rules.
- Scalping can be stressful and demands constant monitoring of charts.
Case Study 1
On the EUR/USD M5 chart, the KAMA line rose above the red baseline, confirming a bullish trend.
Shortly after, the XMaster Formula displayed a yellow up arrow.
A buy trade was entered at 1.1025 with a stop loss at 1.1015 and a take profit at 1.1040.
The trade captured 15 pips within 20 minutes, demonstrating the strategy’s effectiveness in strong intraday trends.
Case Study 2
On the GBP/USD M1 chart, the KAMA line dropped below the red baseline, signaling a bearish trend.
The XMaster Formula then showed a yellow down arrow, triggering a sell entry at 1.3080 with a stop loss at 1.3090 and take profit at 1.3065.
The trade hit its target in just 12 minutes, netting 15 pips and confirming that this strategy works well on lower timeframes for quick scalping profits.
Strategy Tips
- Always confirm the trend direction with the KAMA indicator before taking signals from the XMaster Formula.
- Avoid trading during major economic news releases, as sudden volatility can trigger stop losses prematurely.
- For beginners, start with M5 or M15 charts to reduce the number of trades and manage risk more easily.
- Use a small lot size when testing this strategy live to protect your account from sudden price swings.
- Consider using a trailing stop to lock in profits if the trend continues strongly after the initial target is reached.
Download Now
Download the “KAMA.mq4” indicator for Metatrader 4
FAQ
How does the KAMA Forex Trend Indicator react during ranging markets?
During sideways phases, the adaptive logic slows the line down.
This helps reduce frequent crossovers and keeps traders out of low-quality setups.
Is the default KAMA period suitable for intraday trading?
Yes, a period of 10 works well for intraday trading on M15 to H1 charts.
Shorter periods can be tested for faster reactions if needed.
Can the indicator be used as a standalone system?
It can be traded on its own for trend direction, but results improve when combined with confirmation tools or price action analysis.
Does the KAMA Forex Trend Indicator repaint?
No, the indicator calculates based on closed candles, so signals remain stable once a bar closes.
Summary
The KAMA Forex Trend Indicator for MT4 provides a disciplined way to follow market trends using adaptive logic.
Its smooth red signal line helps traders stay focused on higher-probability setups while avoiding unnecessary trades during unstable conditions.
The indicator is easy to use, flexible, and suitable for different trading styles.
It also combines well with momentum or confirmation indicators in a broader strategy, allowing traders to refine entries and manage trades more effectively.


