
About the KAGI Charts Indicator
The KAGI Charts Indicator for MT4 provides a visual representation of market trends using the Kagi chart method.
It displays a single blue line in a separate MT4 chart window, which changes thickness to signal bullish or bearish momentum.
Thick blue lines indicate a bullish market, while thin blue lines indicate a bearish market.
Traders can use this indicator for entries, exits, or as a confirmation tool for other strategies.
It works on all currency pairs and is suitable for multiple timeframes.
Free Download
Download the “KAGI_1.mq4” indicator for MT4
Key Features
- Displays Kagi chart buy and sell signals
- Blue line changes thickness to indicate bullish or bearish trends
- Simple, visual, and beginner-friendly
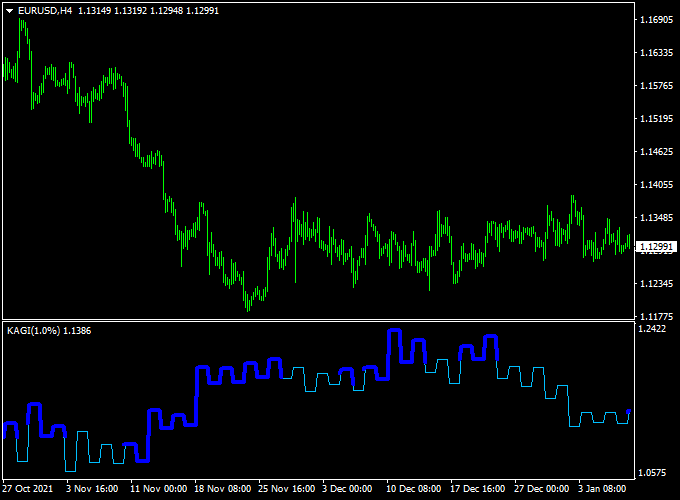
Indicator Chart
The chart shows the KAGI Charts Indicator applied to an MT4 chart.
The thick blue line indicates bullish momentum and potential buy trades, while the thin blue line indicates bearish momentum and potential sell trades.
Traders can follow the line thickness to time entries and exits accurately.
Guide to Trade with the KAGI Charts Indicator
Buy Rules
- Enter a buy trade when the blue line turns thick
- Ensure the overall market trend is bullish before entering
Sell Rules
- Enter a sell trade when the blue line turns thin
- Ensure the overall market trend is bearish before entering
Stop Loss
- Buy trades: below the last swing low or recent thin line
- Sell trades: above the last swing high or recent thick line
Take Profit
- Exit when the line changes thickness in the opposite direction
- Optionally target small pip gains based on the timeframe and pair
- Partial exits can be considered when momentum slows
Practical Tips
- Use the line thickness to follow the market trend
- Combine with support/resistance or candlestick patterns for higher accuracy
- Check higher timeframes to confirm overall trend direction
- Adjust position size based on volatility and pip targets
Kagi Charts + Chandelier Exit MT4 Day Trading Strategy
This day trading strategy combines the Kagi Charts Indicator for MT4 and the Chandelier Exit Indicator for MT4.
The Kagi Charts indicator shows trend direction with line thickness and color: a thick blue line indicates a bullish trend, while a thin blue line signals a bearish trend.
The Chandelier Exit provides potential exit points: a yellow line suggests a buy, and a magenta line indicates a sell.
By combining trend direction with structured exit points, traders can capture intraday moves with defined risk management.
This strategy is suitable for M15 and H1 charts and works well on major currency pairs such as EURUSD, GBPUSD, and USDJPY.
It is ideal for day traders who want to follow trend direction while using systematic exit levels.
Buy Entry Rules
- Confirm that the Kagi Chart line is thick blue, indicating a bullish trend.
- Wait for the Chandelier Exit line to turn yellow, signaling a buy opportunity.
- Enter a buy trade at the close of the confirming candle.
- Stop Loss: place below the most recent swing low or slightly below the Chandelier Exit line.
- Take Profit: aim for a 1.5×–2× risk reward or exit when the Chandelier Exit line turns magenta.
Sell Entry Rules
- Confirm that the Kagi Chart line is thin blue, indicating a bearish trend.
- Wait for the Chandelier Exit line to turn magenta, signaling a sell opportunity.
- Enter a sell trade at the close of the confirming candle.
- Stop Loss: place above the most recent swing high or slightly above the Chandelier Exit line.
- Take Profit: aim for 1.5×–2× risk reward or exit when the Chandelier Exit line turns yellow.
Advantages
- Combines trend-following with systematic exit levels for disciplined day trading.
- Kagi Charts filter out noise and provide a clear trend direction.
- Chandelier Exit lines offer visual exit cues, reducing guesswork.
- Works on multiple pairs and timeframes for day trading setups.
Drawbacks
- Trends may be short-lived in choppy markets, causing frequent stop-outs.
- Entry signals may lag slightly after sudden price spikes.
- Requires monitoring as both trend and exit lines may change during intraday volatility.
- Not suitable for scalping or very short-term trades.
Example Case Study 1 — AUDUSD, M15
During the London session, the Kagi Chart line turned thick blue, signaling a bullish trend.
The Chandelier Exit line switched to yellow.
A buy trade was entered at 0.6685 with a stop loss at 0.6675 and a take profit at 0.6700.
Price trended upward and reached the target within two hours, providing +15 pips.
Example Case Study 2 — USDJPY, H1
During the New York session, the Kagi Chart line turned thin blue, indicating a bearish trend.
The Chandelier Exit line turned magenta, signaling a sell.
A short trade at 149.80 with a stop at 150.00 and a take profit at 149.50 captured a 30 pip move as the price followed the trend for several hours.
Strategy Tips
- Trade only when both indicators confirm the trend and entry direction.
- Adjust stop loss distances depending on volatility and pair behavior.
- Use a fixed reward-to-risk ratio for consistent results.
- Consider exiting early if the trend reverses or the Chandelier Exit signals change.
- Focus on major sessions for stronger price movements.
Download Now
Download the “KAGI_1.mq4” indicator for Metatrader 4
FAQ
What does the line thickness mean?
The blue line thickening signals bullish momentum, while thinning signals bearish momentum. Traders can use these changes to identify entry points.
Which timeframes should I focus on?
Shorter timeframes are better for quick trades, and higher timeframes are useful for confirming overall trends.
Do I need other indicators to make trades?
The Kagi Charts Indicator can be used on its own, but adding support/resistance levels or trend confirmation can improve accuracy.
Summary
The KAGI Charts Indicator for MT4 offers a simple way to track market momentum using line thickness.
Thick blue lines indicate bullish conditions, and thin blue lines indicate bearish conditions.
This tool is suitable for all currency pairs and timeframes, making it ideal for scalping, day trading, or confirming trends.
Traders can follow the line changes to enter and exit trades efficiently, capturing short-term market movements.
Overall, the Kagi Charts Indicator provides an easy-to-read visual method for spotting trading opportunities, helping traders make quicker and more confident decisions in any market.


