
About the JMA Slope Scalper Indicator
The JMA Slope Scalper Indicator for MT4 is designed for scalpers and day traders who want precise entry and exit signals.
It displays a colored trend histogram in a separate MT4 chart window, making it easy to see market direction at a glance.
The histogram shows yellow bars for bullish momentum above the 0.00 level and red bars for bearish momentum below 0.00.
Traders can use this indicator for trade entries, exits, or as a trend filter to confirm signals from other strategies.
Free Download
Download the “JMASlope.mq4” indicator for MT4
Key Features
- Colored trend histogram for clear visual trend signals
- Yellow bars indicate bullish momentum, red bars indicate bearish momentum
- Suitable for scalping, day trading, and trend confirmation
- Can be used for both trade entries and exits
- Helps identify high-probability trades quickly
Indicator Chart
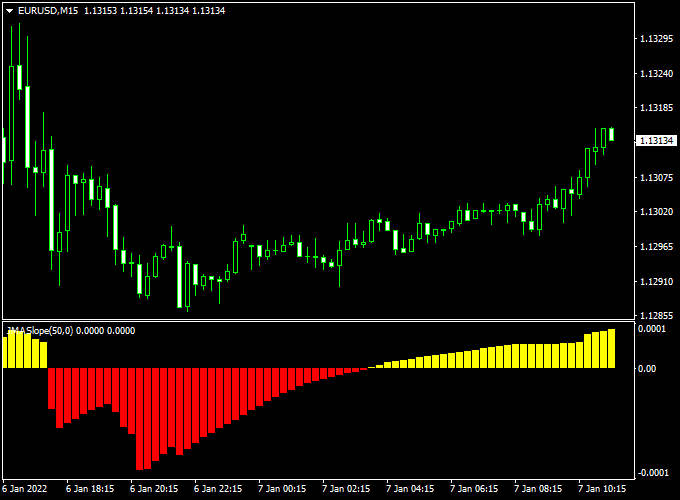
The chart shows the JMA Slope Scalper Indicator applied to an MT4 price chart.
Yellow bars above the 0.00 level indicate a buy signal, while red bars below the 0.00 level indicate a sell signal.
Traders can follow the histogram to time entries and exits accurately.
Guide to Trade with the JMA Slope Scalper Indicator
Buy Rules
- Open a buy trade when the first yellow trend bar appears above 0.00
- Confirm the trade with the overall bullish trend direction
Sell Rules
- Open a sell trade when the first red trend bar appears below 0.00
- Confirm the trade with the overall bearish trend direction
Stop Loss
- Buy trades: below the last swing low or red bar
- Sell trades: above the last swing high or yellow bar
- Adjust for market volatility
Take Profit
- Aim for 8–20 pips per trade
- Or exit when the histogram changes color, signaling an opposite trend
- Partial exits can be used when momentum shows signs of weakening
Practical Tips
- Use the histogram as the main trend signal
- Combine with support/resistance or candlestick patterns for added confirmation
- Adjust position size according to market volatility and pip targets
JMA Slope Scalper + Coppock MT4 Scalping Strategy
This scalping strategy combines the JMA Slope Scalper Forex Indicator for MT4 and the Coppock Forex Indicator for MT4.
The JMA Slope Scalper shows trend direction with colored histogram bars: yellow indicates a bullish trend, red indicates a bearish trend.
The Coppock indicator provides additional confirmation with its histogram: bars above zero signal buys, bars below zero signal sells.
Using both together helps traders scalp quick intraday moves in the direction of the confirmed trend.
This strategy is ideal for M1 and M5 charts, making it suitable for scalpers looking for fast and precise entries.
Major and minor currency pairs can be used depending on volatility and spread, providing flexibility across different market conditions.
Buy Entry Rules
- Confirm that the JMA Slope Scalper histogram bars are yellow, indicating a bullish trend.
- Ensure the Coppock histogram is above zero, confirming bullish momentum.
- Enter a buy trade at the close of the confirming candle.
- Stop Loss: place below the recent swing low or 5–10 pips below the entry.
- Take Profit: target 8–15 pips, or exit when either the JMA Slope turns red or Coppock crosses below zero.
Sell Entry Rules
- Confirm that the JMA Slope Scalper histogram bars are red, indicating a bearish trend.
- Ensure the Coppock histogram is below zero, confirming bearish momentum.
- Enter a sell trade at the close of the confirming candle.
- Stop Loss: place above the recent swing high or 5–10 pips above the entry.
- Take Profit: target 8–15 pips, or exit when either the JMA Slope turns yellow or Coppock crosses above zero.
Advantages
- Combines trend and momentum confirmation for higher-probability scalping entries.
- Visual indicators are easy to read and apply on fast timeframes.
- Works on multiple currency pairs and flexible intraday conditions.
- Reduces false entries by waiting for dual confirmation of trend and momentum.
Drawbacks
- Signals can lag slightly during sharp reversals or news events.
- Scalping requires constant attention and fast execution.
Example Case Study 1 — AUDUSD, M1
During the Asia session, the JMA Slope Scalper histogram turned yellow, indicating a bullish trend.
The Coppock indicator also showed bars above zero.
A buy trade was entered at 0.6680 with a stop loss at 0.6672 and a take profit at 0.6692.
Price moved upward quickly, reaching the target within 12 minutes for a +12 pip gain.
Example Case Study 2 — USDCHF, M5
In the London session, the JMA Slope Scalper histogram turned red, confirming a bearish trend.
The Coppock histogram was below zero, signaling a sell.
A short trade was entered at 0.9050 with a stop loss at 0.9058 and a take profit at 0.9038.
Price dropped as expected and reached the target within 20 minutes, producing +12 pips.
Strategy Tips
- Trade during active sessions for better volatility and tighter spreads.
- Only enter trades when both indicators align for trend and momentum confirmation.
- Keep position sizes small to manage risk during fast scalping sessions.
- Exit immediately if either indicator flips against your trade.
- Backtest the strategy on different pairs to fine-tune stop-loss and take-profit levels.
Download Now
Download the “JMASlope.mq4” indicator for Metatrader 4
FAQ
How do I read the histogram?
Yellow bars above 0.00 indicate a buy signal, and red bars below 0.00 indicate a sell signal. The first bar of a new color signals a potential entry.
What timeframes work best for trading?
Scalpers can use shorter timeframes for quick trades, while intraday traders can use higher timeframes to confirm the trend.
Summary
The JMA Slope Scalper Indicator for MT4 provides a clear visual representation of market momentum using a colored histogram.
Yellow bars show bullish momentum, while red bars show bearish momentum.
It is suitable for all currency pairs and timeframes and can be used for scalping or intraday trading.
Traders can follow the histogram to enter and exit trades with confidence, capturing short-term market moves efficiently.
Overall, this indicator is a simple, practical tool that helps traders spot high-probability trades, manage risk, and make faster trading decisions in a clear and structured way.


