About the JF Trading Times Indicator
The JF Trading Times Indicator for MT4 is a simple but effective tool that helps traders identify the start of the major forex trading sessions.
Highlighting the London and New York session opens allows traders to anticipate periods of higher volatility and better trading opportunities.
The indicator appears as two vertical lines on the main MT4 chart.
The red line marks the London session open, while the brown line marks the New York session open.
This visual aid helps traders plan their strategies around active market hours and manage trades more effectively.
It is ideal for scalpers, intraday traders, and swing traders who want to align their trades with the most active periods of the forex market.
Free Download
Download the “JF_TradingTimes.mq4” indicator for MT4
Key Features
- Displays the London and New York session opens on the chart
- The red vertical line shows the London session open
- The brown vertical line shows the New York session open
- Helps identify periods of higher volatility
- Simple, clear visual representation for quick reference
Indicator Chart
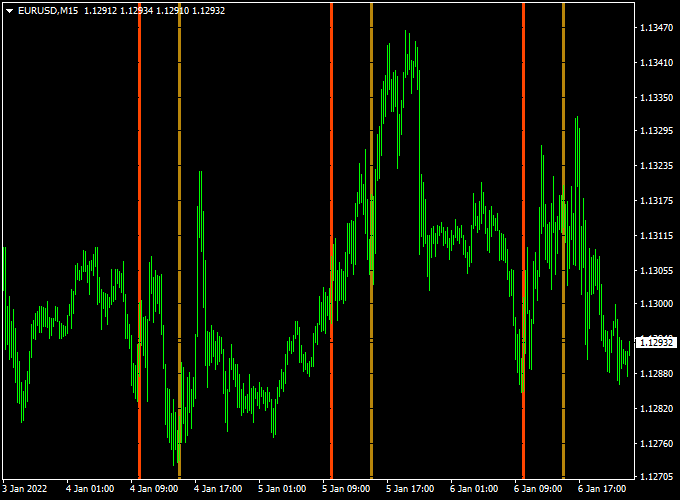
The chart shows the JF Trading Times Indicator applied to an MT4 price chart.
The red vertical line marks the London session open and the brown vertical line marks the New York session open.
This allows traders to quickly see when major sessions begin and adjust their strategies accordingly.

Guide to Trade with the JF Trading Times Indicator
Buy Rules
- Plan buy trades around the London or New York session open when volatility increases
- Combine with trend or breakout indicators for entry confirmation
- Focus on currency pairs most active during the session
Sell Rules
- Plan sell trades during session opens when price movement is stronger
- Confirm with trend direction or breakout signals
- Avoid trading during low liquidity periods outside session hours
Stop Loss
- Use nearby support and resistance levels for stop placement
- Adjust stops according to the session’s expected volatility
Take Profit
- Target key levels reached during session activity
- Close trades when the opposite trend or signal appears
Practical Tips
- Use the indicator to plan trades around London and New York session overlaps
- Combine with trend or breakout indicators for more accurate entries
- Focus on pairs that are most active during each session
London–New York Scalping Strategy for MT4
This MT4 scalping strategy uses two indicators: the JF Trading Times indicator and the Trend Predictor v1.0 indicator.
It focuses on fast entries during the London and New York sessions open when market volatility is high.
The idea is to combine precise timing with clear buy and sell signals.
The vertical session lines from the JF Trading Times indicator highlight when liquidity increases, while the Trend Predictor gives straightforward arrow signals for trade direction.
Why this strategy works
Scalping relies on short bursts of volatility. The London and New York sessions deliver the highest volume and price movement.
The JF Trading Times indicator visually marks those moments with vertical lines, showing exactly when to expect momentum.
The Trend Predictor then confirms the direction with its blue (buy) and red (sell) arrows.
Together, they form a simple and disciplined system that prevents random entries during quiet hours.
This approach works best for traders who enjoy fast trading, quick results, and a structured plan.
It suits the M1, M5, and M15 timeframes, depending on personal speed and chart preference.
It is ideal for EURUSD, GBPUSD, and gold (XAUUSD) during active sessions.
Buy Entry Rules
- Wait for the JF Trading Times indicator to show the vertical line marking the London or New York session open.
- Watch for a blue arrow from the Trend Predictor to appear after or near that session’s open line.
- Confirm that the next candle closes above the recent minor high or above the blue arrow candle.
- Enter a buy trade immediately after the candle closes.
- Stop loss: 10 to 15 pips below the arrow candle’s low (depending on volatility).
- Take profit: 15 to 30 pips, or close the trade when a red arrow appears.
Sell Entry Rules
- Wait for the vertical session line showing the London or New York session open.
- Look for a red arrow from the Trend Predictor to appear near or just after the session opens.
- Confirm that the next candle closes below the recent minor low or below the arrow candle.
- Enter a sell trade on the candle close.
- Stop loss: 10 to 15 pips above the arrow candle’s high.
- Take profit: 15 to 30 pips, or exit when a blue arrow appears.
Advantages
- Uses clear visual signals and timing lines, ideal for fast decision-making.
- Filters out low-volume periods and focuses only on high volatility moments.
- Works on multiple instruments and short timeframes.
Drawbacks
- Not suitable for traders who prefer slow-paced analysis or long-term trades.
- Requires focus and quick execution; missed entries can lead to chasing trades.
- False arrows can appear during news events or whipsaw volatility.
- Spread and slippage can reduce profit on very small targets.
Example case study 1 — EURUSD, M5
At the London open, the JF Trading Times indicator prints a vertical line.
A few candles later, the Trend Predictor shows a blue arrow pointing up.
The next candle closes above the arrow candle’s high, confirming strength.
Buy entry at 1.0780, stop loss 12 pips below the low, target 25 pips.
Within 20 minutes, EURUSD hits 1.0805 for +25 pips.
The session’s open momentum supported a clean breakout move.
Example case study 2 — GBPUSD, M1
During the New York session, the vertical line from JF Trading Times appears.
A red arrow forms on a candle near 1.2720.
Price breaks below that candle low within three bars.
Sell entry at 1.2718, stop loss 10 pips above the high, target 20 pips.
The trade reaches the target in less than ten minutes as volatility spikes at session open, delivering a quick profit.
Strategy tips
- Stick to London and New York opens. Avoid Asian sessions for this method.
- Use a reliable low-spread broker for scalping conditions.
- Avoid trading during major news releases that distort spreads.
- If two arrows appear in opposite directions within the same few minutes, skip the setup.
- Use a fixed reward-to-risk ratio like 2:1 to keep results consistent.
Download Now
Download the “JF_TradingTimes.mq4” indicator for Metatrader 4
FAQ
Can I use the JF Trading Times Indicator on any currency pair?
Yes. It works on all major, minor, and exotic currency pairs.
Which timeframe is recommended?
The indicator works on all timeframes. Traders often use it on M15, M30, and H1 charts to plan session-based trades.
Can I trade solely based on session opens?
Session opens are best used as a timing tool. Combine with other indicators or price action analysis for trade confirmation.
Summary
The JF Trading Times Indicator for MT4 helps traders clearly see when the London and New York sessions open with red and brown vertical lines.
This allows for better timing of trades during periods of higher activity.
Traders can use it to anticipate volatility, align trades with active sessions, and manage positions more effectively.


