About the Inside Bar Breakout Indicator
The Inside Bar Breakout Indicator for Metatrader 4 is a price action trading tool built to capture breakout moves after short periods of consolidation.
Inside bars form when price pauses within the range of the previous candle, often signaling that a strong move may follow.
This indicator automatically detects valid inside bar patterns and plots two horizontal breakout levels on the chart.
These levels represent the high and low of the inside bar and stay fixed until price breaks through one of them.
The Inside Bar Breakout Indicator works purely on price behavior and does not repaint.
Once the levels appear, traders can prepare their entries in advance and wait for confirmation.
Free Download
Download the “Inside bar.mq4” indicator for MT4
Key Features
- Automatic identification of inside bar formations
- Fixed horizontal breakout levels above and below price
- Non-repainting logic based on closed candles
- Designed for breakout and momentum trading
- Easy to combine with trend-following tools
Indicator Chart
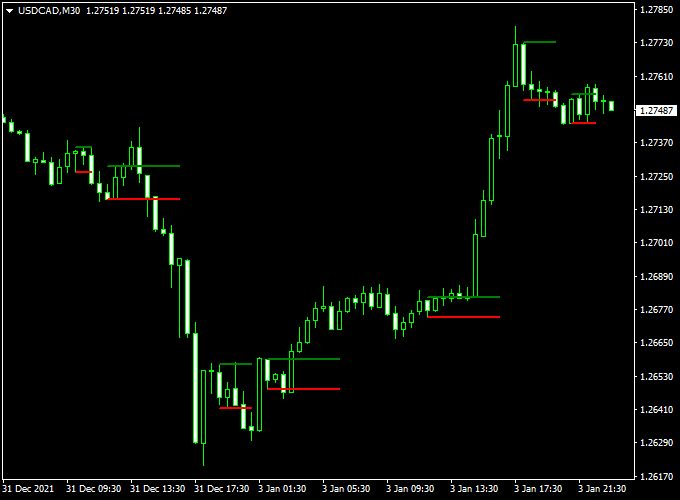
The chart displays the Inside Bar Breakout Indicator applied to a live MT4 price chart.
The green horizontal line marks the upper breakout level, while the red horizontal line marks the lower breakout level.
A candle close beyond either line signals a potential buy or sell breakout based on price action.

Guide to Trade with the Inside Bar Breakout Indicator
Buy Rules
- Wait for the indicator to detect a valid inside bar
- Confirm that the overall market trend is upwards
- Enter a buy trade when a candle closes above the green inside bar line
Sell Rules
- Allow the indicator to mark an inside bar setup
- Confirm that the broader market trend is downwards
- Enter a sell trade after a candle closes below the red inside bar line
Stop Loss
- For buy trades, place the stop loss below the red inside bar line
- For sell trades, place the stop loss above the green inside bar line
- Add a small buffer to account for spread and short-term volatility
Take Profit
- Set take profit near the next support or resistance area
- Use a fixed risk-to-reward ratio such as 1:2 or higher
- Trail the stop loss once price shows strong continuation
Practical Tips
- Trade inside bar breakouts in the direction of the higher timeframe trend
- London and New York sessions often provide stronger breakout momentum
- Wait for a full candle close beyond the breakout level before entering
- Combine the indicator with a simple trend filter for better consistency
- Reduce position size on lower timeframes to manage false breakouts
Inside Bar Breakout + Trend Predictor MT4 Strategy
This strategy combines the Inside Bar Breakout MT4 Indicator with the Trend Predictor V1.0 MT4 Indicator to create a simple yet effective trading approach.
The Inside Bar Breakout identifies potential price breakouts, while the Trend Predictor confirms the market direction.
This combination helps traders enter trades with higher probability, filtering out false breakouts.
The strategy works well on M15, M30, and H1 time frames, making it suitable for swing traders and intraday traders.
It focuses on aligning breakouts with the prevailing trend to maximize potential gains while minimizing risk.
Buy Entry Rules
- Wait for a breakout above the green horizontal inside bar on the Inside Bar Breakout indicator.
- Confirm that the Trend Predictor shows a blue arrow, indicating a bullish trend.
- Enter a buy trade at the close of the breakout candle.
- Set a stop loss just below the lowest point of the inside bar.
- Set a take profit at a risk-reward ratio of 1:2 or at the next significant resistance level.
Sell Entry Rules
- Wait for a breakout below the red horizontal inside bar on the Inside Bar Breakout indicator.
- Confirm that the Trend Predictor shows a red arrow, indicating a bearish trend.
- Enter a sell trade at the close of the breakout candle.
- Set a stop loss just above the highest point of the inside bar.
- Set a take profit at a risk-reward ratio of 1:2 or at the next significant support level.
Advantages
- Combines breakout signals with trend confirmation for higher accuracy.
- Easy to follow with clear entry and exit rules.
- Suitable for multiple time frames, from M15 to H1.
- Helps avoid false breakouts by using the trend indicator.
- Allows precise stop loss placement based on the inside bar structure.
Drawbacks
- It may produce fewer trades since both indicators need to align.
- Can give delayed signals in highly volatile markets.
- Requires discipline to stick to the entry and exit rules.
- Not ideal for scalping on very low time frames like M1.
Example Case Study 1
On the EUR/USD H1 chart, the price formed an inside bar with a green horizontal line. The Trend Predictor displayed a blue arrow.
A breakout above the inside bar occurred, and the trade was entered at 1.1050.
The stop loss was placed at 1.1030, just below the inside bar.
The take profit was set at 1.1090.
The trade captured 40 pips within a few hours, following the confirmed bullish trend.
Example Case Study 2
On the GBP/USD M30 chart, a red horizontal inside bar appeared, and the Trend Predictor showed a red arrow.
When the price broke below the inside bar, a sell trade was executed at 1.3150.
The stop loss was at 1.3170, above the high of the inside bar, and the take profit target was 1.3110.
The trade successfully gained 40 pips, following the trend predictor’s bearish signal.
Strategy Tips
- Always confirm the breakout with the Trend Predictor signal before entering.
- Avoid trading during major news events to reduce the chance of false breakouts.
- Combine this strategy with support and resistance analysis for higher probability trades.
- Regularly backtest and adjust take profit levels according to market conditions.
Download Now
Download the “Inside bar.mq4” indicator for Metatrader 4
FAQ
Does the Inside Bar Breakout Indicator repaint?
No. The indicator is based on closed candles only, and once the breakout levels are drawn, they remain unchanged.
Is this indicator suitable for beginners?
Yes. The rules are easy to follow, making it suitable for traders learning price action breakouts.
Can this indicator be used as a standalone system?
It can be traded on its own, but results often improve when aligned with a trend filter or higher timeframe bias.
Summary
The Inside Bar Breakout Indicator for MT4 offers a disciplined approach to trading price breakouts using inside bar formations.
Its non-repainting behavior and fixed breakout levels allow traders to plan and execute trades with confidence.
The indicator is easy to apply, works across all currency pairs, and adapts to different trading styles.
It combines especially well with trend-following indicators, which can help filter weaker setups and improve overall performance.
With consistent execution and proper risk management, the Inside Bar Breakout Indicator can become a reliable component of a professional price action trading strategy.


