About the Heiken Ashi Candlestick Indicator
The Heiken Ashi Candlestick indicator for MetaTrader 4 converts the standard price chart into Heiken Ashi candlesticks.
These modified candles reduce market noise and highlight the prevailing trend more clearly.
Bullish momentum is represented by white Heiken Ashi candles, while bearish momentum is shown with red candles.
This visual approach helps traders stay in trends longer and avoid false entries caused by minor price fluctuations.
It allows traders to follow trends effortlessly and make decisions based on the overall market direction.
Free Download
Download the “Heiken Ashi.mq4” indicator for MT4
Key Features
- Transforms the standard chart into Heiken Ashi candles
- White candles indicate bullish trends
- Red candles indicate bearish trends
- Reduces price noise for smoother trend visualization
- Works on all MT4 time frames and currency pairs
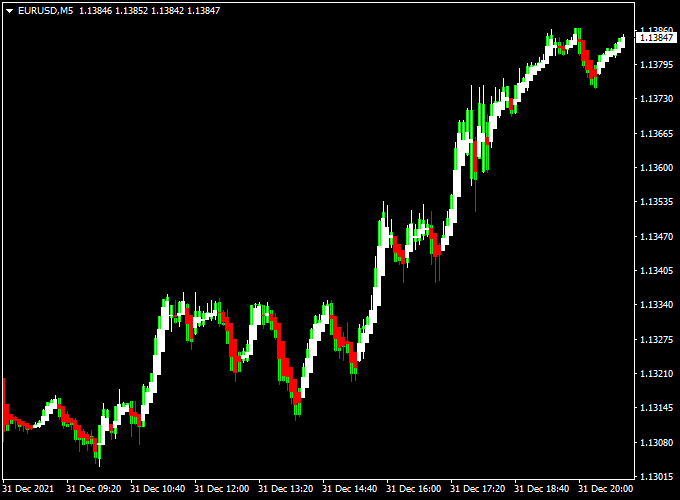
Indicator Chart
The Heiken Ashi Candlestick indicator shows smooth white and red candles directly on the MT4 chart.
White candles signal upward momentum, while red candles signal downward momentum.
Traders use these candle colors to determine entry points, trend strength, and potential reversals.

Guide to Trade with Heiken Ashi Candlestick Indicator
Buy Rules
- Enter a buy trade when the first white Heiken Ashi candle appears
- Stay in the trade while consecutive white candles persist
Sell Rules
- Enter a sell trade when the first red Heiken Ashi candle appears
- Remain in the trade while red candles continue
Stop Loss
- For buy trades, place the stop just below the low of the first white candle
- For sell trades, place the stop just above the high of the first red candle
- Use recent swing points as a reference for safer stops
Take Profit
- Target the next support or resistance level in the trend direction
- Consider partial exits after a strong move
- Trail stops along the trend using the Heiken Ashi candles
- Exit when the candle color reverses
Practical Trading Tips
- Follow trends indicated by consecutive Heiken Ashi candles.
- Do not chase trades when the color briefly changes.
- Scale position sizes according to market volatility.
- Use candle color changes to plan entries and exits efficiently.
Heiken Ashi + Flat Trend RSI MT4 Day Trading Strategy
Introduction
This strategy combines the smooth trend visualization of the Heiken Ashi Candlestick Indicator (MT4) with the trend confirmation from the Flat Trend RSI Indicator (MT4).
Heiken Ashi candles simplify price action: white candles signal bullish momentum while red candles indicate bearish pressure.
The Flat Trend RSI shows the overall trend: a blue histogram represents a bullish trend and a red histogram represents a bearish trend.
This setup is designed for short-term trading on M1, M5, M15, M30, and H1 charts.
It is ideal for intraday traders who want quick, precise entries with a clear trend filter.
Buy Entry Rules
- The Flat Trend RSI histogram must be blue, indicating a bullish trend.
- A white Heiken Ashi candle closes, signaling a buy opportunity.
- Enter the trade at the close of the white candle.
- Stop loss: place below the most recent swing low or the low of the previous Heiken Ashi candle.
- Take profit: initial target 1.5× risk. Move stop to breakeven after half the target is reached.
- Trail the stop behind the lows of subsequent white candles to maximize profits.
Sell Entry Rules
- The Flat Trend RSI histogram must be red, indicating a bearish trend.
- A red Heiken Ashi candle closes, signaling a sell opportunity.
- Enter the trade at the close of the red candle.
- Stop loss: place above the most recent swing high or above the high of the previous Heiken Ashi candle.
- Take profit: initial target 1.5× risk. Move stop to breakeven after half the target is reached.
- Trail the stop above the highs of subsequent red candles for extended moves.
Advantages
- Heiken Ashi candles smooth price action, reducing noise on fast time frames.
- Flat Trend RSI provides a clear trend filter to avoid countertrend trades.
- Simple visual cues make the strategy easy to follow for M1 to H1 charts.
- Works well for quick intraday trades across multiple currency pairs.
Drawbacks
- Lag in Heiken Ashi candles may cause slightly delayed entries.
- Choppy or sideways markets can produce false signals.
- Requires strict discipline to follow the trend filter and stop loss rules.
- Stop losses may be triggered frequently on very short time frames (M1–M5) if the market is volatile.
Example Case Study 1 — AUD/USD M5 (Bullish)
On the M5 AUD/USD chart, the Flat Trend RSI histogram turns blue.
A white Heiken Ashi candle closes above the previous candle.
Entry is taken at the close of the white candle.
Stop loss is placed below the low of the previous candle.
Price moves steadily upward, hitting the first target of 1.5× risk within 25 minutes.
Trailing stops behind subsequent white candles capture additional profit as the trend continues.
Example Case Study 2 — USD/JPY M15 (Bearish)
USD/JPY on the M15 chart shows the Flat Trend RSI histogram turning red.
A red Heiken Ashi candle closes below the previous candle, confirming a sell signal.
Entry is taken at the candle close.
Stop loss is set above the previous swing high. Price trends downward steadily, reaching the initial target in 40 minutes.
Trailing stops above the highs of following red candles capture additional profit before the trend reverses.
Strategy Tips
- Always trade in the direction of the Flat Trend RSI histogram to avoid countertrend losses.
- Do not enter trades when the histogram changes color frequently, indicating indecision.
- Combine with higher timeframe trend analysis for stronger setups.
- Use small position sizes while testing on M1 and M5 charts to manage drawdowns.
- Monitor economic news releases that may cause sudden volatility and false signals.
- Keep a trading journal to track Heiken Ashi candle patterns that consistently work on your preferred currency pairs.
Download Now
Download the “Heiken Ashi.mq4” indicator for Metatrader 4
FAQ
How do Heiken Ashi candles differ from regular candles?
Heiken Ashi candles are calculated using averages of open, close, high, and low prices.
This smooths price action and highlights trends, unlike standard candles that show raw price movement.
Can I use this indicator on any currency pair?
Yes. The Heiken Ashi indicator works on all forex pairs, as well as indices, commodities, and other MT4 instruments.
Should I combine Heiken Ashi with other indicators?
Yes. Combining it with trend or momentum indicators can improve entry timing and reduce the chance of entering counter-trend moves.
How do I know when a trend is ending?
Watch for a color change in the Heiken Ashi candles. Consecutive candles in the opposite color often indicate a trend reversal or pause.
Summary
The Heiken Ashi Candlestick indicator for MT4 helps traders follow trends more easily by transforming the chart into smooth white and red candles.
It reduces noise and highlights the dominant market direction.
It works on any pair or time frame and fits both beginner and experienced trading strategies.
When used together with other trend or confirmation indicators in the strategy section, it enhances trade accuracy and keeps entries aligned with strong market momentum.


