About the HeatMap Multi-Color Indicator
The HeatMap Multi Color indicator for MetaTrader 4 helps traders quickly identify the dominant market trend.
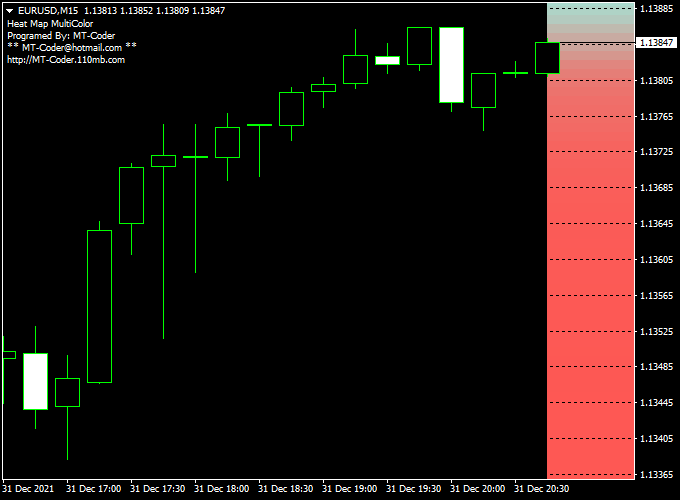
It uses a multi-colored heatmap displayed as a bar on the right side of the chart, showing bullish and bearish conditions at a glance.
When the currency pair is trading in the blue area of the heatmap, the trend is bullish.
When trading in the red area, the trend is bearish.
This makes it easy to align trades with the current market direction and filter out counter-trend noise.
The indicator is highly customizable.
Traders can adjust colors, layouts, and input settings to match their chart style.
Free Download
Download the “Heat_Map_MultiColor.mq4” indicator for MT4
Key Features
- Displays a color-coded trend heatmap on the main chart
- Blue area signals bullish trend, red area signals bearish trend
- Customizable colors and layouts
- Works on all currency pairs and time frames
- Helps confirm trades and identify market direction
Indicator Chart
The HeatMap Multi Color indicator chart shows a colored bar on the right side of the MT4 window.
The bar changes color based on the current trend, making it easy to see if the market is bullish or bearish.
Traders use this visual heatmap to decide whether to enter long or short positions, and to filter trades in the direction of the dominant trend.

Guide to Trade with HeatMap Multi Color Indicator
Buy Rules
- Enter a buy trade when the heatmap shows blue
- Confirm trend direction on higher time frames
- Check for nearby support levels to strengthen the trade setup
- Enter after the candle confirms bullish momentum
Sell Rules
- Enter a sell trade when the heatmap shows red
- Confirm trend direction on higher time frames
- Check for nearby resistance levels
- Enter after the candle confirms bearish momentum
Stop Loss
- For buy trades, place the stop below the most recent swing low
- For sell trades, place the stop above the most recent swing high
- Leave some space for normal price fluctuations
- Use nearby heatmap trend boundaries as guidance for safer stops
Take Profit
- Set the initial target near the next support or resistance level
- Consider partial profits once a significant move occurs
- Trail stops along the heatmap trend to capture extended moves
- Exit if the heatmap color reverses against your trade
Practical Trading Tips
- Trade only when the heatmap color is clear and stable.
- Avoid trades during sideways or choppy markets.
- Do not chase trades when the heatmap briefly changes color.
- Scale position size according to volatility.
- Use the heatmap to confirm trades rather than trigger entries alone.
Forex Heatmap + Alligator Trend MT4 Strategy
This strategy combines the color-zone logic of a heatmap indicator with the Alligator indicator for entries.
The heatmap gives you a broad trend zone: if the price is trading in the blue zone, the trend is considered bullish; if the price is in the red zone, it’s bearish.
Then you use the Alligator (jaw, teeth, lips) to time your actual entries.
This works best on intraday time frames such as 15- and 30-minute charts.
You can also test it on 1-hour charts.
It is suitable for traders who like a hybrid approach: a trend filter plus a dynamic entry indicator.
Buy Entry Rules
- First, ensure price is trading in the blue zone of the heatmap (trend bias = bullish).
- Confirm Alligator alignment: the Lips (fast line) is above the Teeth, and the Teeth above the Jaw, and all three are sloping upward (spread apart).
- This indicates the Alligator is opening its mouth upward.
- Wait for a pullback toward the Alligator (toward the middle lines) without exiting the blue zone, followed by a bullish candle that moves away from the Alligator.
- Enter on the candle close.
- Stop loss: place below the Jaw (or below the most recent swing low) to give enough room, but respect risk limits.
- Take profit: target at least 1.5× risk (1:1.5).
- You may trail stop behind the Alligator lines (for example, below Teeth or Jaw) as the price moves in your favor.
Sell Entry Rules
- First, ensure price is trading in the red zone of the heatmap (trend bias = bearish).
- Confirm Alligator alignment downward: Lips < Teeth < Jaw, and all three sloping downward and spreading.
- The Alligator’s mouth opens downward.
- Wait for a small retracement up toward the Alligator (but staying within or not leaving the red zone), then enter on a bearish candle close, breaking away downward.
- Stop loss: place above the Jaw (or above the recent swing high).
- Take profit: target 1.5× risk or more.
- Trail using the Alligator lines (for example, above Teeth or Jaw) as the trend continues.
Advantages
- The trend filter from the heatmap helps you avoid countertrend entries.
- Alligator gives dynamic entries and trailing guidance (mouth opening, line spacing).
- Combining both reduces false signals—only trade when both agree.
- Works well in trending conditions, letting you ride moves while filtering noise.
Drawbacks
- Lag in Alligator: You may miss the initial part of the move.
- Risk of getting stopped prematurely if pullbacks are sharp.
- Requires discipline to wait for the confirmation and not enter early.
Example Case Study 1 — EUR/USD 30-minute (Bullish)
On a 30-minute EUR/USD chart, the Forex heatmap enters the blue zone and stays there.
The Alligator lines align upward: Lips above Teeth above Jaw, and diverging.
Price pulls back toward the Teeth, then a bullish candle closes above the Teeth, moving away.
Entry is taken at that close.
The stop loss is set below the Jaw, and the first target (1.5× risk) is hit within a few bars.
The trend continues, so the stop is trailed behind the Alligator lines and the trade closes later for a larger gain.
Example Case Study 2 — GBP/USD 15-minute (Bearish)
GBP/USD in 15-minute shows price in the Forex heatmap red zone.
The Alligator lines align downward (Lips < Teeth < Jaw).
Price rallies slightly toward the Teeth but remains in the red zone, then a bearish candle breaks below the Teeth.
Entry is taken on that candle close.
The stop is placed above the Jaw.
Price moves down strongly, hitting the 1.5× risk target, then trailing continues and yields extra profit before reversal.
The strategy worked cleanly in that trending move.
Strategy Tips
- Use a higher timeframe (1H or 4H) trend direction as a filter: only take trades in the direction of the higher timeframe trend.
- Do not trade if the heatmap is unstable or flipping colors rapidly.
- Avoid entering when Alligator lines are too tight or overlapping (no clear trend). Wait for clear divergence.
- Use small position sizes while testing to manage drawdowns.
- Always use a stop loss and trail stops to protect gains.
- Backtest thoroughly on different currency pairs to find which pairs behave best with this combo.
- Adjust heatmap settings or colors if needed so that your blue and red zones cleanly represent strong trends.
Download Now
Download the “Heat_Map_MultiColor.mq4” indicator for Metatrader 4
FAQ
What do the colors on the heatmap represent?
Blue indicates a bullish trend and red indicates a bearish trend. The heatmap bar provides a visual summary of market direction.
Can the colors be customized?
Yes. Traders can adjust colors, layouts, and other inputs to match personal preferences or chart style.
Can the heatmap be used alone?
It can guide trend direction, but using it alongside entry or momentum indicators improves trade accuracy.
Summary
The HeatMap Multi Color indicator for MT4 provides a simple, visual way to follow market trends.
By clearly showing bullish and bearish zones, it helps traders align entries with the strongest momentum.
It works on any currency pair and time frame, making it suitable for scalping, day trading, and swing strategies.
When combined with trend or confirmation indicators from the strategy section, it can increase trade accuracy and improve decision-making.


