
About the Harami Pattern Indicator
The Harami Pattern indicator for MetaTrader 4 is a candlestick-based tool designed to detect potential trend reversals.
It automatically identifies bullish and bearish Harami formations and marks them directly on the price chart.
A Harami pattern consists of a large candle followed by a smaller candle contained within its range.
These formations often indicate a slowing of momentum and a possible reversal or pause in the current trend.
The indicator displays blue arrows for bullish Harami patterns and red arrows for bearish patterns.
By highlighting these signals in real time, traders can anticipate trend changes and plan entries more effectively.
Free Download
Download the “Harami.mq4” indicator for MT4
Key Features
- Automatically detects bullish and bearish Harami patterns
- Displays blue and red arrows directly on the main chart
- Works on any MT4 time frame and currency pair
- Alerts traders to potential trend reversals
- Helps confirm entry points with candlestick formations
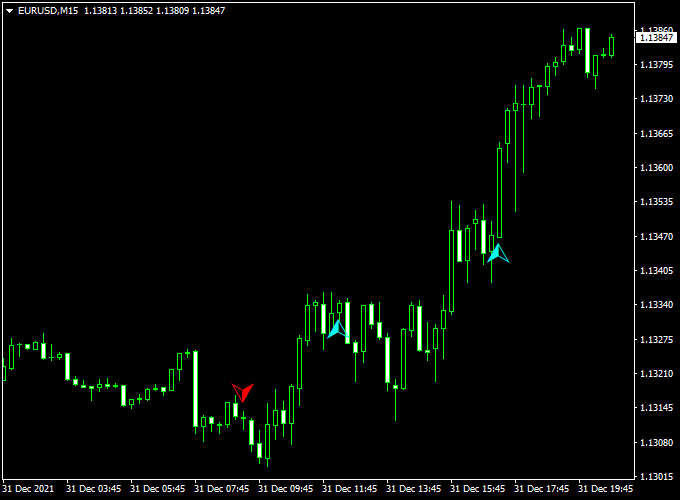
Indicator Chart
The Harami Pattern indicator chart shows colored arrows on the MT4 chart window.
Blue arrows indicate bullish reversal signals, while red arrows indicate bearish reversal signals.
Traders use these signals to anticipate trend pauses or reversals and combine them with price action or trend indicators for stronger setups.
Guide to Trade with Harami Pattern Indicator
Buy Rules
- Wait for a blue arrow to appear on the chart
- Confirm bullish momentum or support level
- Enter a buy trade at the close of the signal candle
- Use additional confirmation from trend or momentum indicators if needed
Sell Rules
- Wait for a red arrow to appear on the chart
- Confirm bearish momentum or resistance level
- Enter a sell trade at the close of the signal candle
- Use extra confirmation for stronger setups
Stop Loss
- For buy trades, place the stop below the low of the Harami formation
- For sell trades, place the stop above the high of the Harami formation
- Allow a small buffer to avoid being stopped out by normal market noise
Take Profit
- Set the initial target at the next swing high or low
- Consider partial exits after significant moves
- Trail stops following price movement to capture extended trends
- Close trades if the next opposite Harami pattern appears
Practical Trading Tips
- Trade only confirmed patterns with clear preceding trends.
- Avoid trading in sideways markets with frequent false signals.
- Use higher time frames for stronger and more reliable Harami signals.
- Combine with trend or momentum indicators for better entries.
- Do not chase arrows that appear near strong support or resistance zones.
Day Trading Strategy: Harami Pattern + ADX Trend MA (MT4)
This day trading strategy combines the Harami Pattern Indicator and the ADX Trend MA Indicator to identify high-probability intraday trades.
The Harami Pattern Indicator detects bullish and bearish candlestick formations, displaying a blue arrow for bullish patterns and a red arrow for bearish patterns.
The ADX Trend MA Indicator confirms trend direction: enter a buy when the blue signal line crosses above the orange line and a sell when the blue line crosses below the orange line.
This combination works best on 5-minute to 1-hour charts and is suitable for traders aiming to capture intraday trend reversals.
Buy Entry Rules
- Wait for a blue arrow on the Harami Pattern Indicator indicating a bullish pattern.
- Confirm a buy trade when the blue line on the ADX Trend MA crosses above the orange signal line.
- Enter the buy trade at the close of the confirming candle.
- Set the stop loss below the recent swing low or nearby support level.
- Set take profit at a 1:2 reward-to-risk ratio or exit if the ADX blue line crosses below the orange line or a red Harami arrow appears.
Sell Entry Rules
- Wait for a red arrow on the Harami Pattern Indicator indicating a bearish pattern.
- Confirm a sell trade when the blue line on the ADX Trend MA crosses below the orange signal line.
- Enter the sell trade at the close of the confirming candle.
- Set the stop loss above the recent swing high or nearby resistance level.
- Set take profit at a 1:2 reward-to-risk ratio or exit if the ADX blue line crosses above the orange line or a blue Harami arrow appears.
Advantages
- Combines candlestick reversal patterns with trend confirmation for higher-probability entries.
- Visual signals make it easy to identify bullish and bearish setups.
- ADX Trend MA confirmation reduces the risk of entering trades against the prevailing trend.
- Works across multiple currency pairs and intraday timeframes.
Drawbacks
- May produce delayed entries if waiting for both Harami confirmation and ADX crossover alignment.
- Exotic pairs may generate inconsistent results due to irregular volatility.
- High-impact news events can lead to rapid reversals and hit stop losses.
Case Study 1
On the EUR/USD 30-minute chart, a blue Harami arrow appeared, and the ADX Trend MA blue line crossed above the orange line.
A buy trade was entered at 1.1880, with a stop loss at 1.1855 and a take profit at 1.1930. The position hit its take-profit target in just three hours, securing a gain of 50 pips.
Case Study 2
On the GBP/JPY 1-hour chart, a red Harami arrow appeared, and the ADX Trend MA blue line crossed below the orange line.
A sell trade was entered at 149.30, with a stop loss at 149.65 and a take profit at 148.55.
Within four hours, the trade achieved its target and booked a 75-pip gain.
Strategy Tips
- Confirm with higher time frames. Only take Harami signals that align with the trend on a larger time frame to filter false entries.
- Wait for the candle close. Enter after the candle closes above or below the ADX crossover to validate the signal.
- Combine with support and resistance. Look for Harami patterns at key levels to increase accuracy.
- Use ATR-based stops. Set stop-loss levels based on current volatility instead of fixed pips.
- Stagger take-profits. Take partial profits at the first swing level and trail the rest with a stop tied to the ADX Trend MA.
- Test across pairs. Try this setup on volatile pairs like GBP/JPY, USD/CAD, or AUD/JPY for larger moves.
Download Now
Download the “Harami.mq4” indicator for Metatrader 4
FAQ
What does a blue or red arrow indicate?
A blue arrow signals a bullish Harami, suggesting potential upward reversal. A red arrow signals a bearish Harami, suggesting potential downward reversal.
Which time frames are best?
The indicator works on all time frames. H1, H4, and daily charts often produce the most reliable signals.
Can the Harami Pattern be traded alone?
It can be used as a standalone reversal tool, but combining it with trend or momentum indicators improves signal reliability.
Summary
The Harami Pattern indicator for MT4 simplifies trend reversal detection by marking bullish and bearish Harami patterns directly on the chart.
It helps traders anticipate market turns and plan entries more efficiently.
It is suitable for traders of all levels and works well with other trend-following or momentum tools from the strategy section.
By combining pattern recognition with confirmation indicators, traders can enter trades in line with high-probability setups.


