About the RSI with CCI Indicator
The RSI with CCI indicator for MT4 is a beginner-friendly trend trading tool that filters sideways price action.
It plots colored bars in a separate MT4 window to indicate market conditions.
Green bars signal bullish trends, red bars show bearish trends, and yellow bars highlight ranging or sideways periods.
This clear visual approach helps traders focus on high-probability trades while avoiding choppy markets.
By combining RSI and CCI algorithms, the indicator identifies momentum and trend strength simultaneously.
It works effectively across all currency pairs and timeframes, making it suitable for scalpers, day traders, and swing traders.
Free Download
Download the “gfk forex2.ex4” indicator for MT4
Key Features
- Colored trend bars in a separate MT4 window
- Green bars for bullish trends, red bars for bearish trends
- Yellow bars highlight sideways markets
- Combines RSI and CCI for momentum and trend strength
- Beginner-friendly and easy to read
- Works across all timeframes and currency pairs
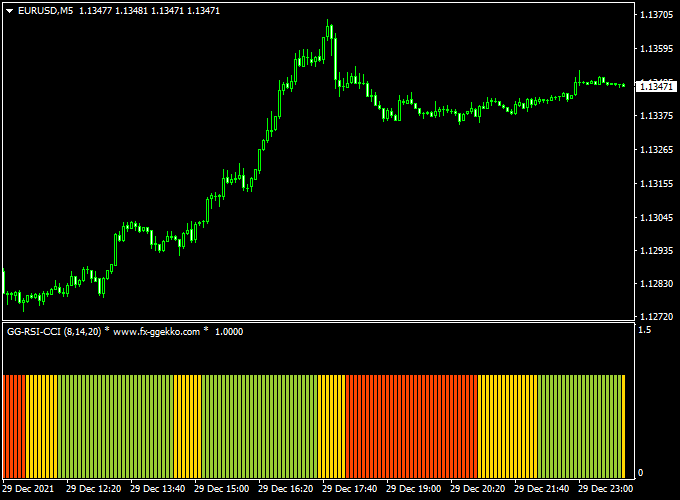
Indicator Chart
The chart example shows the RSI with CCI indicator applied to an MT4 chart.
Green bars indicate strong upward momentum, red bars indicate downward momentum, and yellow bars highlight periods to avoid trading.

Guide to Trade with RSI with CCI Indicator
Buy Rules
- Enter a buy trade when the first green bar appears
- Confirm that price action supports the upward trend
- Avoid entering during yellow bar periods
Sell Rules
- Enter a sell trade when the first red bar appears
- Confirm that price action supports the downward trend
- Avoid entering during yellow bar periods
Stop Loss
- For buy trades, place the stop loss a few pips below the previous green bar low
- For sell trades, place the stop loss a few pips above the previous red bar high
- Adjust based on market volatility to avoid being stopped out prematurely
Take Profit
- Close the trade when the bar color changes or shows weakening momentum
- Set targets near recent swing highs for buys or swing lows for sells
- Consider scaling out partial profits as the trend progresses
Practical Tips
- Stand aside during yellow bar periods to avoid sideways market noise
- Use higher timeframes to confirm the main trend
- Combine with price action or moving averages for stronger confirmation
- Adjust trade size according to market volatility
- Focus on currency pairs with clear trending behavior
RSI & CCI Trend + Gann Scalper MT4 Intraday Strategy
This intraday strategy combines the RSI with CCI Forex Trend Indicator MT4 and the Gann Forex Scalper Indicator MT4 to capture short-term trends.
The RSI with CCI shows momentum via histogram bars, while the Gann Scalper provides precise entry signals.
It works well on 15-minute, 30-minute, and 1-hour charts, making it ideal for intraday traders seeking quick trades across multiple currency pairs.
Buy Entry Rules
- Trend Confirmation: RSI with CCI histogram is green, indicating bullish momentum.
- Entry Signal: Wait for a green buy arrow from the Gann Scalper Indicator.
- Trade Execution: Enter a buy trade at the close of the arrow candle.
- Stop Loss: Place below the nearest swing low or a small percentage based on your risk tolerance.
- Take Profit: Set at a 1:1.5 to 1:2 risk/reward ratio or near the next short-term resistance.
Sell Entry Rules
- Trend Confirmation: RSI with CCI histogram is red, indicating bearish momentum.
- Entry Signal: Wait for a red sell arrow from the Gann Scalper Indicator.
- Trade Execution: Enter a sell trade at the close of the arrow candle.
- Stop Loss: Place above the nearest swing high or a small percentage based on your risk tolerance.
- Take Profit: Set at a 1:1.5 to 1:2 risk/reward ratio or near the next short-term support.
Advantages
- Combines trend confirmation and precise entries for high-probability intraday trades.
- Works on multiple short-term timeframes.
- Reduces false signals by waiting for both indicators to align.
- Adaptable to several currency pairs like EUR/USD, USD/JPY, and AUD/USD.
Drawbacks
- Sideways or choppy markets may produce fewer accurate signals.
- Requires active monitoring of trades for intraday setups.
- Smaller pip targets mean multiple trades may be needed to accumulate profits.
Case Study 1: EUR/USD 15-Minute Chart
On May 10, the RSI with CCI histogram turned green on the 15-minute chart.
A green arrow from the Gann Scalper appeared at 10:30.
A buy trade was executed at 1.0980, stop loss at 1.0965, and take profit at 1.1005.
The trade reached the target within 45 minutes, earning 25 pips.
Case Study 2: AUD/USD 30-Minute Chart
On May 12, the RSI with CCI histogram turned red on the 30-minute chart.
A red arrow from the Gann Scalper appeared at 14:00.
A sell trade was entered at 0.6785, stop loss at 0.6800, and take profit at 0.6760.
The trade reached the take profit in 90 minutes, netting 25 pips.
Strategy Tips
- Always wait for the candle close to confirm signals on short timeframes.
- Use small lot sizes for intraday trades to manage risk effectively.
- Focus on major currency pairs for better liquidity and tighter spreads.
- Consider trailing stops to secure profits as the price moves in your favor.
- Avoid trading during major news releases to prevent volatility spikes.
Download Now
Download the “gfk forex2.ex4” indicator for Metatrader 4
FAQ
Can the RSI with CCI indicator be combined with other tools?
Yes. Many traders use it alongside moving averages, trend lines, or support/resistance levels to confirm entry points.
How do I interpret yellow bars?
Yellow bars indicate sideways price action. Traders should avoid entering trades during these periods to reduce false signals.
Is it effective on all currency pairs?
Yes. The indicator works across all major and minor pairs, but it performs best on pairs with clear trending behavior.
Can this indicator be used for scalping?
Yes. On lower timeframes, it helps spot short-term trends, but it’s recommended to confirm with higher-timeframe trend direction.
Summary
The RSI with CCI indicator for MT4 offers a simple and effective way to trade trends while filtering sideways movement.
Its colored bar system allows traders to enter with confidence and avoid low-probability trades.
It works best when combined with trend-following tools such as moving averages or channel indicators.
This combination improves trade accuracy by confirming the direction of the main trend and avoiding entries against market momentum.
With proper risk management, the RSI with CCI indicator can be a reliable tool for scalpers, day traders, and swing traders.


