
About the Fractals Trend Line Breakout Indicator
The Fractals Trend Line Breakout Indicator for MT4 is a breakout-focused trading tool built around fractal logic.
It automatically draws dynamic support and resistance trend lines on the price chart.
These lines help traders identify moments when price is ready to break out of consolidation.
The indicator plots two colored lines directly in the main MT4 chart window.
The green line represents resistance, while the red line represents support.
When price closes beyond one of these levels, it signals a potential breakout trade.
Because the trend lines are based on fractals, they adjust naturally to recent market swings.
This makes the indicator suitable for scalping, intraday trading, and breakout-based strategies across all timeframes.
Free Download
Download the “fractals-adjustable-period-trend-lines.mq4” indicator for MT4
Key Features
- Automatic fractal-based support and resistance lines
- Green resistance and red support breakout levels
- Signals plotted directly on the main MT4 chart
- Effective on lower and higher timeframes
- Ideal for breakout and momentum traders
Indicator Chart
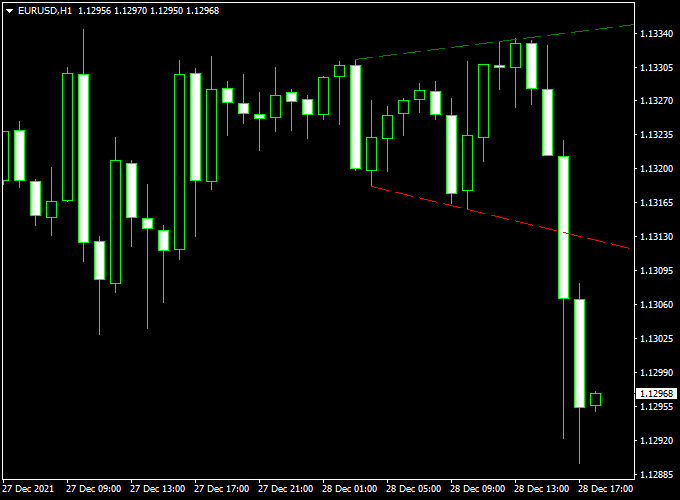
The chart shows the Fractals Trend Line Breakout Indicator applied to an MT4 price chart.
Green and red trend lines highlight resistance and support levels.
Breakout signals occur when the price closes beyond these fractal-based lines.
Guide to Trade with the Fractals Trend Line Breakout Indicator
Buy Rules
- Wait for the price to close above the green breakout line
- Confirm the breakout candle has solid momentum
- Enter a buy trade at the opening of the next candle
Sell Rules
- Wait for the price to close below the red breakout line
- Confirm the breakout candle shows strong selling pressure
- Enter a sell trade at the opening of the next candle
Stop Loss
- Place the stop just below the broken green line for buy trades
- Place the stop just above the broken red line for sell trades
- Allow small breathing room to avoid stop hunts
- Widen stops slightly on higher timeframes
Take Profit
- Target the next major support or resistance zone
- Use a fixed reward ratio such as 1:2
- Secure partial profits after strong breakout moves
- Exit if the price closes back inside the breakout zone
Practical Tips
- Trade breakouts during active market sessions
- Ignore weak breakouts with small candle bodies
- Use higher timeframe trend direction as a filter
- Avoid entries before high-impact news
- Combine with momentum indicators for confirmation
Fractal Trend-Line Breakout + Gann Trend Oscillator MTF Strategy for MT4
This MT4 trading strategy merges breakout signals from the Fractals Trend-Line Breakout Indicator (MT4) with a trend bias filter from the Gann Trend Oscillator MTF Indicator (MT4).
The fractal indicator alerts entries when the price breaks above a green dotted fractal line (for buys) or below a red dotted line (for sells).
Meanwhile, the Gann oscillator confirms trend direction: blue histogram bars = bullish, violet bars = bearish.
Because the fractals define breakout zones and the Gann oscillator ensures you only trade in the favored direction, this setup filters out many false signals.
It is best used on shorter timeframes (M5, M15) or for intraday moves.
Who Should Use This
Traders who prefer clear breakout entries but still want trend confirmation.
Good for those using MT4 with disciplined risk control and comfortable with moderate trade frequency.
Timeframes & Pairs
Recommended primary chart: M5 or M15.
Use the Gann oscillator on the same timeframe or on a higher timeframe to get a smoother trend.
Best on major FX pairs: EUR/USD, GBP/USD, USD/JPY, AUD/USD, USD/CHF.
Buy Entry Rules
- The Gann Trend Oscillator must show bullish bias (blue histogram bars).
- A fractal breakout occurs: price closes above the green dotted fractal line. That is your entry trigger.
- Enter long at the close of the breakout candle (or on a small pullback toward the breakout zone if you prefer).
- Stop Loss: place SL just below the red dotted fractal line or a buffer below the recent swing low (whichever is more conservative).
- Take Profit: set TP based on a fixed reward-to-risk (e.g., 1.5× to 2× your risk) or target the next fractal breakout line or swing high.
- If Gann bars reverse to violet (bearish), consider closing the long position early.
Sell Entry Rules
- The Gann Trend Oscillator must show bearish bias (violet histogram bars).
- A fractal breakout occurs: price closes below the red dotted fractal line. That is your signal to sell.
- Enter short at the close of that breakout candle or on a slight retracement back toward the breakout level.
- Stop Loss: Place SL just above the green dotted fractal line or above the recent swing high (whichever is more conservative).
- Take Profit: use a fixed R:R (1.5× to 2×) or target the next lower fractal line or swing low.
- If Gann bars flip to blue (bullish), exit the short position.
Advantages
- Uses clear breakout levels (fractals) for entry, reducing guesswork.
- Trend filter via Gann oscillator reduces counter-trend trades.
- Works well in trending markets with momentum.
- Relatively simple rules, easy to backtest and automate.
Drawbacks
- In choppy or sideways markets, breakouts may fail or whipsaw.
- Late entries are possible if you wait for confirmation. You may miss part of the move.
- Tight stops and small timeframes increase susceptibility to noise and slippage.
- You must choose timeframes and filter settings carefully for each pair.
Example Case Study 1 — EUR/USD, M15 (Bullish)
Setup
On EUR/USD in M15, the Gann histogram bars turn blue (bullish).
A green dotted fractal line lies just above the recent price.
Price breaks above that fractal line with a strong close.
Execution
Enter long at that close.
SL set a few pips below the red dotted fractal line. TP at 1.8× risk.
Price continues upward and reaches TP. Trade yields profit aligned with trend bias.
Example Case Study 2 — GBP/USD, M5 (Bearish)
Setup
On GBP/USD in M5, the Gann oscillator shows violet bars (bearish).
A red dotted fractal line lies above recent candles.
Price breaks below that fractal line with conviction.
Execution
Enter short at the close of the breakout candle.
SL is placed above the green dotted line or recent swing high.
TP at 2× risk or near the next fractal lower. Price falls sharply and hits TP.
Strategy Tips
- Only trade breakouts beyond the fractal lines (green for buy, red for sell). Do not enter prematurely.
- Use the Gann oscillator strictly as the trend filter. Reject entries when they don’t agree.
- Prefer trading during active sessions (London, New York) when momentum is stronger and moves are cleaner.
- Keep risk small per trade. The SL may be wider in volatile pairs—adjust position size accordingly.
- Backtest this strategy across multiple currency pairs and timeframe combinations to find what works best for you.
Download Now
Download the “fractals-adjustable-period-trend-lines.mq4” indicator for Metatrader 4
FAQ
Why does the indicator use fractals?
Fractals help identify meaningful swing points.
This allows the trend lines to reflect real market structure rather than fixed levels.
Can this indicator be used for scalping?
Yes. On lower timeframes, it provides frequent breakout opportunities suitable for fast trades.
Does every breakout lead to a strong move?
No. Filtering trades with session timing and momentum improves overall performance.
Is it better for trending or ranging markets?
It performs best when price transitions from consolidation into a directional move.
Summary
The Fractals Trend Line Breakout Indicator for MT4 is designed to help traders spot breakout opportunities based on real price structure.
Its dynamic support and resistance lines adapt to changing market conditions.
The indicator is easy to read, flexible across timeframes, and well suited for momentum-based strategies.
It also combines well with trend or volatility indicators to improve breakout confirmation.


