About the Fourier Extrapolator Forecast Indicator
The Fourier Extrapolator Indicator for MT4 predicts future market movements using the Fourier trading algorithm.
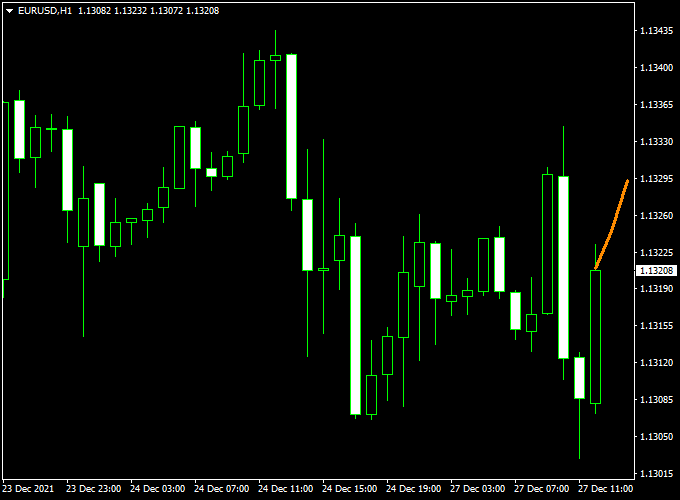
It displays an orange forecast line on the main MT4 chart, showing the expected price path based on past market cycles.
Traders can use this tool to anticipate potential trend continuation or reversals.
A buy trade may be considered when the forecast line is above the current price in an uptrend.
A sell trade may be considered when the forecast line is below the current price in a downtrend.
Free Download
Download the “fourier-extrapolator.mq4” indicator for MT4
Key Features
- Predictive trend indicator using Fourier analysis
- The orange forecast line shows potential price movement
- Helps anticipate trend continuation or reversals
- Displays directly on the main MT4 chart
- Supports informed decision-making and trade planning
Indicator Chart
The chart below shows the Fourier Extrapolator applied to MT4.
The orange line predicts the future trend, helping traders align their positions with expected market movements.
Use this visual guide to determine potential buy and sell opportunities.

Guide to Trade with the Fourier Extrapolator
Buy Rules
- Consider a buy if the orange line is above the current price
- Confirm the overall trend is upwards
- Open the trade at the next candle open
Sell Rules
- Consider a sell if the orange line is below the current price
- Confirm the overall trend is downwards
- Open the trade at the next candle open
Stop Loss
- For buy trades, set a stop below the recent swing low
- For sell trades, set a stop above the recent swing high
- Adjust stops for volatility and timeframe
- Consider slightly wider stops in choppy markets
Take Profit
- Set take profit near the next significant support or resistance level
- Consider trailing the stop as the forecast line moves in your favor
- Partial profit can be taken if the price deviates from the forecast line
- Close fully if the trend shows early reversal signals
Practical Tips
- Use the indicator with trend confirmation for safer entries
- Avoid trading solely based on the forecast line in sideways markets
- Focus on major currency pairs with clear price cycles
- Test on a demo account before applying live
- Combine with support/resistance or momentum tools for better accuracy
Intraday Strategy: Fourier Extrapolator + Non-Lag AMA Indicator MT4
This intraday strategy blends the predictive power of the Fourier Extrapolator Forecast Indicator with a smooth trend filter using a Non-Lag AMA (adaptive moving average) line.
The idea is simple: use the Fourier indicator’s forecast line to sense upcoming direction, but only take trades that align with the trend shown by the Non-Lag AMA.
This reduces noise and improves probability. It works best on intraday charts (M5, M15, M30) for scalpers or day traders wanting clean setups.
Buy Entry Rules
- The Fourier Extrapolator must draw an orange forecast line above the current price (indicating a bullish forecast).
- The Non-Lag AMA line must slope upward, and the price must be above the AMA (i.e., bullish trend).
- Wait for a pullback toward the AMA or a small retracement — you don’t want to chase the extreme move.
- Enter a buy trade when price action shows a bullish candlestick (e.g., engulfing or strong close) confirming the move upward.
- Place a stop loss a few pips under the swing low or below the AMA line.
- Set take profit at a 1:1 or 1.5:1 reward/risk, or you may trail the trade using the AMA line as dynamic support.
Sell Entry Rules
- The Fourier Extrapolator must draw an orange forecast line below the current price (indicating a bearish forecast).
- The Non-Lag AMA line must slope downward, and the price must be below the AMA (i.e., bearish trend).
- Wait for a retracement up toward the AMA line or a pullback.
- Enter a sell trade when a bearish candlestick confirms the downward move (e.g., strong close or rejection candle).
- Place a stop loss a few pips above the swing high or the AMA line.
- Set take profit at 1:1 or 1.5:1 reward/risk, or trail using the AMA line as dynamic resistance.
Advantages
- Predictive forecast line gives early insight into potential directional moves.
- Non-Lag AMA filters against taking trades in whipsaw or ranging market noise.
- Combines lead (forecast) with trend confirmation to reduce false entries.
- Suitable for fast intraday moves while maintaining discipline.
Drawbacks
- Forecasts might sometimes mislead ahead of sudden reversals or news spikes.
- On tight ranges, the strategy may produce few signals and many false signals.
- Stop losses may be triggered frequently if the market is choppy around the AMA line.
- Trail or exit rules may need active monitoring, increasing trader workload.
Example Case Study 1
On EUR/USD M15, the Fourier Extrapolator forecast line moved above the price, signaling bullish potential.
The Non-Lag AMA was sloping upward, and the price was above the AMA.
After a small pullback toward the AMA, a bullish engulfing candle formed.
A buy was entered, stop loss placed under the recent low, take profit set at 1.5× risk.
Price climbed and hit the target within the hour, riding the upward trend.
Example Case Study 2
On GBP/JPY M5, the Fourier line dipped below the price, indicating a bearish forecast.
The AMA was sloping down, and the price was under it.
A pullback to the AMA preceded a bearish rejection candle.
A sell order was opened.
Stop loss placed above swing high, take profit at 1× risk.
The trade moved in favor and hit the target before a reversal signal appeared.
Strategy Tips
- Prefer high-liquidity pairs (EUR/USD, GBP/USD, USD/JPY) to reduce slippage.
- Avoid trading during major news releases or volatile events.
- Test on demo first to refine the offset distance for stop loss relative to AMA and recent swing.
- Consider scaling out part of the position at the first target and trailing the rest with the AMA line.
- Do not force entries if conditions do not align clearly — patience is key.
Download Now
Download the “fourier-extrapolator.mq4” indicator for Metatrader 4
FAQ
Does the indicator repaint?
No, the forecast line is based on historical data and does not change once printed.
How reliable is the forecast line?
It predicts trends based on Fourier analysis of past price cycles, but should be combined with risk management and trend confirmation.
Is it suitable for all currency pairs?
Yes, though major pairs typically produce smoother and more reliable predictions.
Summary
The Fourier Extrapolator Forecast Indicator for MT4 provides a predictive tool to anticipate future market trends.
The orange forecast line shows potential price movement and helps align trades with expected trends.
Used with proper trend confirmation, support/resistance, and risk management, this indicator can enhance trading decisions.
By pairing the Fourier Extrapolator’s predictive signals with the Non-Lag AMA’s trend smoothing, traders can anticipate market direction ahead of time.
This creates an intraday approach that offers both early insight and reliable trend validation. Stick to your rules, manage risk strictly, and refine with live testing.


