About the Flat Trend RSI Indicator
The Flat Trend RSI Indicator for MT4 combines the power of the Relative Strength Index (RSI) with a digital filter to provide clear trend signals.
It helps traders spot bullish and bearish momentum while filtering out market noise.
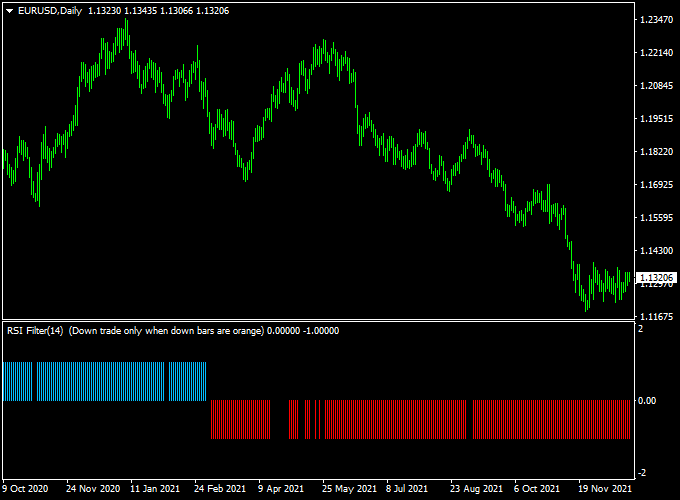
Displayed in a separate MT4 window, the indicator shows blue bars for upward trends and red bars for downward trends, positioned above or below the 0.00 neutral line.
The default RSI period is set to 14, but traders can adjust this value to suit different timeframes or trading styles.
This no-repaint indicator is ideal for spotting trend direction in real time.
It works on all currency pairs and timeframes, making it useful for both intraday trading and swing strategies.
Free Download
Download the “Flat_Trend_RSI.ex4” indicator for MT4
Key Features
- No-repaint trend indicator combining RSI and a digital filter
- Blue bars indicate bullish trends for buy opportunities
- Red bars indicate bearish trends for sell opportunities
- Bars appear relative to the 0.00 neutral level for easy trend visualization
- Customizable RSI period to match different market conditions
- Works on all currency pairs and multiple timeframes
Indicator Chart
The chart shows blue and red histogram bars reflecting the RSI trend.
Blue bars appear above the neutral line indicating potential buy momentum, while red bars below the line indicate potential sell momentum.
Traders can use this visual guide for quick entry decisions.

Guide to Trade with Flat Trend RSI Indicator
Buy Rules
- Enter a buy trade when the first blue bar appears above the 0.00 level.
- Confirm trend direction using the previous few bars for momentum consistency.
- Optional: cross-check with higher timeframe trends for additional confirmation.
Sell Rules
- Enter a sell trade when the first red bar appears below the 0.00 level.
- Observe subsequent bars to ensure the trend is continuing downward.
- Optional: Use a trend filter or moving average to reduce false signals.
Stop Loss Placement
- Buy trades: just below the nearest swing consolidation or minor support zone.
- Sell trades: just above the nearest swing consolidation or minor resistance zone.
- Alternatively, set a fixed pip distance based on your risk tolerance or use ATR for adaptive stops.
Take Profit Targets
- Set take profit near the next support/resistance levels or pivot points.
- Partial profit can be taken when bars start fading toward neutral.
- Trailing stops can help capture extended trends safely.
Practical Trading Tips
- Adjust the RSI period to suit the volatility of the currency pair.
- Focus on high-volume sessions to improve signal reliability.
- Combine with higher timeframe trends to filter false signals.
- Use the neutral 0.00 line as a visual reference for market balance.
- Experiment with bar color and size for better chart readability.
Flat Trend RSI + MBFX Timing MT4 Forex Strategy
The Flat Trend RSI + MBFX Timing MT4 strategy is designed for traders who want clear, high-probability intraday entries.
It combines the Flat Trend RSI Indicator, which highlights momentum shifts with color-coded histogram bars, and the MBFX Forex Timing Indicator.
This indicator plots a smooth green or orange line in a subwindow to reveal optimal timing.
By aligning momentum with timing, the strategy provides straightforward buy and sell signals that work especially well on the 5-minute, 15-minute, and 30-minute charts during the London and
New York sessions.
Buy Entry Rules
- Wait until the Flat Trend RSI prints blue histogram bars (bullish momentum).
- Confirm that the MBFX Timing line has turned green in the subchart at the close of the candle.
- Enter a buy trade at the close of that candle.
- Place a stop loss a few pips below the latest swing low.
- Set take profit at around 1.5:1 risk-reward or at the next intraday resistance zone (rather than a fixed 2:1 target).
Sell Entry Rules
- Wait until the Flat Trend RSI prints red histogram bars (bearish momentum).
- Confirm that the MBFX Timing line has turned orange in the subchart at the close of the candle.
- Enter a sell trade at the close of that candle.
- Place a stop loss a few pips above the latest swing high.
- Set take profit at approximately 1.5:1 risk-reward or the next intraday support zone.
Advantages
- Combines momentum with timing for higher quality signals.
- Visual and easy to interpret, even for beginners.
- Flexible profit targets allow adaptation to market conditions.
- Effective during major sessions (London/New York).
Drawbacks
- Whipsaws are possible in low volatility conditions.
- Profit targets are not fixed, requiring some discretion.
- Not designed for long-term holding; best for day trades.
Case Study 1: EUR/USD on 15-Minute Chart
During the London session, the Flat Trend RSI printed blue histogram bars, and the MBFX Timing line turned green near 1.0920.
A buy was taken at 1.0922.
Stop loss was placed at 1.0910 (12 pips risk).
Because the price was near a minor resistance at 1.0942, the take profit was set at 1.0940 for an 18-pip target.
Price rose and hit the target within the session, netting +18 pips.
Case Study 2: GBP/USD on 5-Minute Chart
In the New York session, the Flat Trend RSI showed red histogram bars while the MBFX Timing line turned orange near 1.2785.
A sell order was placed at 1.2783.
The swing high was at 1.2792, so the stop loss was at 1.2794 (11 pips risk).
Because the next support zone was at 1.2768, the take profit was set there for a +15 pip gain.
Price moved downward and reached the target smoothly.
Strategy Tips
- Check higher timeframes to ensure overall trend direction before entering.
- Adjust take profit according to nearby support/resistance instead of fixed pip goals.
- Avoid trading right before major news releases.
- Use consistent position sizing to keep risk per trade stable.
Download Now
Download the “Flat_Trend_RSI.ex4” indicator for Metatrader 4
FAQ
Can the RSI period be changed?
Yes. The default period is 14, but traders can adjust it to better fit shorter or longer timeframes.
Does this indicator repaint?
No. Once the bars appear, they stay fixed on the chart, giving traders reliable trend information.
Which timeframes are recommended?
It works on all timeframes. Shorter charts like M15 or M30 are good for intraday trades, while H1–H4 are better for swing trades.
Can this indicator be used alone?
Yes. It provides clear trend direction on its own, but combining with support/resistance or other trend indicators can improve accuracy.
Summary
The Flat Trend RSI Indicator for MT4 is a trend-following tool that merges RSI momentum with a digital filter to provide clear buy and sell signals.
Blue and red bars above and below the neutral line help traders identify potential entries efficiently.
By combining it with higher timeframe trends or other indicators, traders can enhance signal accuracy, manage risk, and capture profitable moves across different market conditions.


