About the Fixed Chart Scale Indicator
The Fixed Chart Scale Indicator for MT4 is a practical tool designed to keep your Forex charts consistent by locking the scale.
It ensures that price movements and patterns are displayed proportionally, making it easier to analyze trends and chart formations.
Unlike traditional indicators, it does not provide buy or sell signals.
Instead, it improves chart visibility and prevents automatic zoom changes when switching timeframes or currency pairs.
This makes pattern recognition, trend analysis, and technical studies more reliable and consistent.
Ideal for professional traders and analysts, the Fixed Chart Scale Indicator is useful for monitoring price movements with precision and maintaining visual consistency across multiple charts.
Free Download
Download the “fixed-chart-scale.mq4” indicator for MT4
Key Features
- Keeps the chart scale fixed for consistent analysis
- Prevents automatic zoom changes when switching timeframes
- Helps accurately compare price movements across charts
- Works on all currency pairs and timeframes
- Improves clarity for technical analysis and pattern recognition
- Lightweight and easy to use
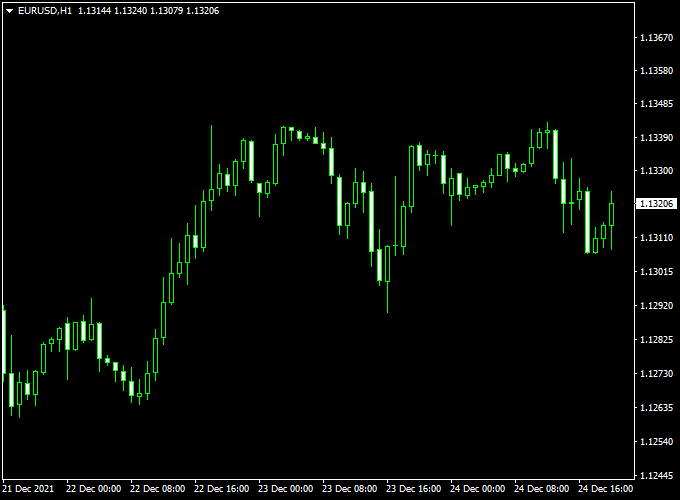
Indicator Chart
The chart displays price movements with a fixed scale, ensuring that candlesticks, trendlines, and patterns maintain proportional size.
Traders can monitor trends, support and resistance levels, and price patterns without visual distortion.

Guide to Use Fixed Chart Scale Indicator
Setup Instructions
- Attach the indicator to any MT4 chart.
- Adjust the fixed scale ratio in the indicator’s input settings if needed.
- The scale will remain locked even when switching timeframes or chart pairs.
Practical Tips
- Use on multiple charts to maintain uniform visual comparison.
- Combine with other MT4 indicators like trendlines, Fibonacci, or pivot points for accurate technical analysis.
- Check the scale periodically if you manually zoom in or out to ensure consistency.
- Ideal for traders who rely on pattern recognition or price action strategies.
MT4 Day Trading Strategy with Fixed Chart Scale & Magic Trend Indicator
This strategy combines the visual consistency of the Fixed Chart Scale Forex Indicator with the trend signals from the Magic Trend Forex Indicator.
While the Fixed Chart Scale doesn’t generate signals itself, it ensures your price scale remains constant—helping you see moves more clearly and maintain your perspective.
The Magic Trend indicator is your signal engine: a green line signals a buy trend, and a red line signals a sell trend.
Why This Combination Works & Who It’s For
In fast intraday trading, visual clarity helps. With a locked chart scale, distortions from auto-scaling or zooming are removed.
Traders can better judge pullbacks, strength, and support/resistance levels consistently.
Meanwhile, the Magic Trend indicator gives a simple trend signal: go long when the line is green, short when it’s red.
That lets you trade in the direction of the trend with fewer distractions.
This strategy is intended for day trading on intraday timeframes such as M5, M15, or M30.
It is suited for traders who prefer fewer, higher-quality signals rather than overtrading.
You should trade during active hours (London, New York) to get volatility and momentum.
Buy Entry Rules
- Ensure your chart is using the Fixed Chart Scale indicator so that price movements are visually consistent.
- Wait for the Magic Trend line to turn green (indicating a bullish trend).
- Enter a buy order at the close of the candle where the line first becomes green (or immediately after, if confirmed).
- Set a stop loss below the recent swing low or below a key support level.
- Set take profit at a risk:reward of 1.5:1 or 2:1, or use a fixed profit target.
Sell Entry Rules
- Use the Fixed Chart Scale to maintain consistent visual scaling.
- Wait for the Magic Trend line to turn red (bearish trend).
- Enter a sell order at the close of the candle when the line turns red (if confirmed by price action).
- Put a stop loss above the recent swing high or just above the trend line’s recent peak.
- Take profit at 1.5:1 or 2:1, or use a fixed profit target.
Advantages
- Visual consistency from Fixed Chart Scale helps reduce misjudgment of moves and pullbacks.
- The Magic Trend indicator provides clear and easy-to-read trend signals (green = buy, red = sell).
- Strategy is simple and uncluttered—less noise, fewer indicators to interpret.
- Works well in trending intraday markets when trends are strong and directional.
Drawbacks
- It may lag in very fast moves or when trend changes abruptly—signals might come late.
- In sideways or range-bound markets, you may get false signals or whipsaws when the trend line flips often.
- No reversal confirmation indicator is included, so wrong entries may happen without a filter.
- Requires discipline to wait for the trend line change and not jump early.
Case Study 1: EUR/USD on 15-Minute Chart
During the London session, after a period of consolidation, the Magic Trend line turned green at around 1.1350.
A buy trade was entered at 1.1353 at the close of that candle.
The recent swing low was at 1.1342, so the stop loss was placed at 1.1340 (13 pips risk).
The target was set at a 2:1 reward-to-risk ratio (26 pips), making the take profit 1.1379.
Price moved steadily upward and hit the target, netting 26 pips.
Case Study 2: GBP/USD on 5-Minute Chart
During the New York session, after a brief uptrend, the Magic Trend line turned red near 1.3100.
A sell order was placed at 1.3098 once the candle closed with the red line confirmed.
The swing high was at 1.3110, so the stop loss was placed at 1.3112 (14 pips risk).
The take profit was set to a 2:1 reward-to-risk ratio (28 pips), so TP = 1.3070.
Price dropped and reached the target, producing a profit of 28 pips.
Strategy Tips
- Always trade high-liquidity pairs (EUR/USD, GBP/USD, USD/JPY) to minimize spreads and slippage.
- Use a higher timeframe (e.g., H1) to check if the trend aligns with the Magic Trend signal—only take trades that match the higher timeframe trend.
- Avoid entering just before major news releases, as sudden reversals can cause trend line flips and false entries.
- Consider trailing your stop when the price moves favorably to lock in profits.
- Backtest different Magic Trend settings (periods, smoothing) to find what works best for your preferred pair.
Download Now
Download the “fixed-chart-scale.mq4” indicator for Metatrader 4
FAQ
Does the Fixed Chart Scale Indicator provide trade signals?
No. This indicator only locks the chart scale for consistent visual analysis. It does not generate buy or sell signals.
Can it be applied to all currency pairs and timeframes?
Yes. It works on all Forex pairs and can be applied to any timeframe without affecting chart functionality.
Will the chart zoom automatically with this indicator?
No. The scale remains fixed, preventing automatic zoom when switching timeframes or currency pairs.
Is it suitable for beginners?
Yes. It is simple to use and helps beginners maintain consistent chart views, which improves analysis and reduces confusion.
Summary
The Fixed Chart Scale Indicator for MT4 is a simple yet essential tool for traders who want consistent and proportional chart displays.
By locking the chart scale, it ensures accurate pattern recognition and reliable technical analysis across multiple charts.
While it does not provide buy or sell signals, it complements any trading strategy by maintaining visual consistency.
It works on all currency pairs and timeframes and is particularly useful for traders relying on price action, trendlines, and technical patterns.


