About the FiboPiv Daily DK Forex Indicator
The FiboPiv Daily DK Indicator for MT4 is an advanced price action tool that combines daily pivot points with Fibonacci retracement and extension levels.
It provides traders with clear guidance on key market levels for potential trade entries, exits, and profit targets.
Displayed directly on the main MT4 chart window, the indicator plots the pivot point as a red horizontal line and overlays all relevant Fibonacci levels, helping traders visualize the areas where price is likely to react.
Traders can use the indicator to identify high-probability setups in both trending and range-bound markets.
Free Download
Download the “FiboPiv_Daily_DK.mq4” indicator for MT4
Key Features
- Displays the daily pivot point and all Fibonacci retracement and extension levels
- Pivot point clearly marked with a red horizontal line
- Visual guide for potential support, resistance, and reaction zones
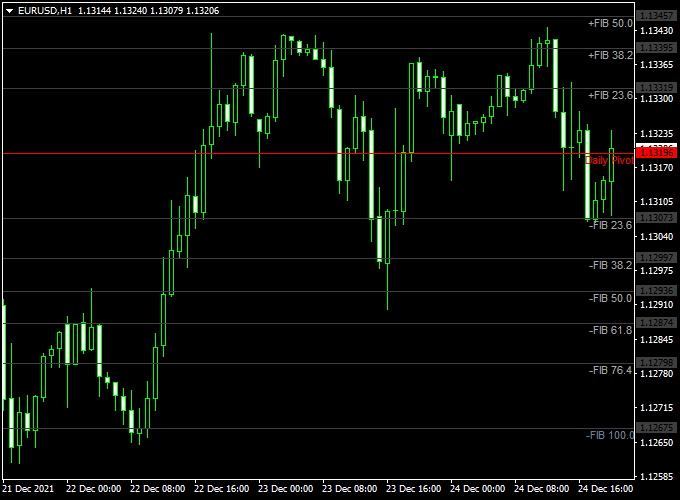
Indicator Chart
The chart example shows multiple daily pivot points along with Fibonacci retracement and extension levels plotted over price action.
Price interactions with these levels help traders identify potential buy or sell zones, anticipate reversals, and set realistic profit targets for both bullish and bearish trades.

Guide to Trade with FiboPiv Daily DK Indicator
Buy Rules
- Wait for the price to close above the daily pivot point line.
- Look for confirmation through bullish candlestick patterns or short consolidation near the pivot.
- Enter a buy trade at the opening of the next candle once support at the pivot is confirmed.
Sell Rules
- Wait for the price to close below the daily pivot point line.
- Look for bearish confirmation, such as rejection candles or downward momentum.
- Enter a sell trade at the start of the next candle after confirmation.
Stop Loss Placement
- For buy trades, place a stop loss slightly below the nearest Fibonacci support level.
- For sell trades, place a stop loss slightly above the nearest Fibonacci resistance level.
- Adjust stop distances based on volatility and timeframe.
Take Profit Targets
- For buy trades, target the next Fibonacci resistance levels sequentially.
- For sell trades, target the next Fibonacci support levels sequentially.
- Partial exits at intermediate levels can secure profits while allowing the remainder to ride the trend.
Practical Trading Tips
- Focus on trades that follow the dominant trend on higher timeframes.
- Monitor price reactions at pivot and Fibonacci levels to identify high-probability setups.
- Customize line colors and thickness for better chart visibility.
FiboPiv Daily DK & 2 Moving Average Arrow Forex Day Trading Strategy for MT4
This day trading strategy combines the FiboPiv Daily DK Indicator MT4 and the 2 Moving Average Arrow Indicator MT4 to provide clear entry and exit signals for intraday trading.
The FiboPiv Daily DK indicator uses pivot points with Fibonacci levels to identify potential reversals and target zones.
The 2 Moving Average Arrow Indicator adds confirmation with blue arrows for buy signals and magenta arrows for sell signals.
This combination is ideal for day trading on 15-minute, 30-minute, or 1-hour charts.
Buy Entry Rules
- Price closes above the daily pivot point on the FiboPiv Daily DK indicator, indicating bullish sentiment.
- Confirm with a blue arrow from the 2 Moving Average Arrow Indicator.
- Enter a buy position at the market open of the next candle.
- Set stop loss just below the pivot point or recent swing low.
- Take profit at the nearest Fibonacci resistance level provided by the FiboPiv indicator.
Sell Entry Rules
- Price closes below the daily pivot point on the FiboPiv Daily DK indicator, indicating bearish sentiment.
- Confirm with a magenta arrow from the 2 Moving Average Arrow Indicator.
- Enter a sell position at the market open of the next candle.
- Set stop loss just above the pivot point or recent swing high.
- Take profit at the nearest Fibonacci support level provided by the FiboPiv indicator.
Advantages
- Combines pivot point levels with Fibonacci targets for precise trade entries and exits.
- Additional arrow confirmation improves trade accuracy and reduces false signals.
- Suitable for day trading with intraday timeframes, helping traders capture multiple trades per day.
- Clear visual signals make it beginner-friendly while remaining useful for advanced traders.
Drawbacks
- Requires monitoring during market hours to act on intraday signals quickly.
- Not suitable for very short-term scalping due to reliance on daily pivot levels.
Case Study 1: EUR/JPY 30-Minute Chart
On the EUR/JPY 30-minute chart, the price closed above the daily pivot point, and a blue arrow appeared on the 2 Moving Average Arrow Indicator.
A buy position was entered at the next candle, with a stop loss below the pivot point.
The price moved upward and reached the first Fibonacci resistance level, achieving a profit of approximately 35 pips.
This trade demonstrates the effectiveness of combining pivot points with moving average confirmation for day trading.
Case Study 2: USD/CAD 1-Hour Chart
On the USD/CAD 1-hour chart, the price closed below the daily pivot point, and a magenta arrow appeared, signaling a sell trade.
A position was opened at the next candle with a stop loss above the pivot point.
The price declined to the first Fibonacci support level, generating a profit of around 42 pips.
This case shows how using both pivot points and moving average arrows can provide reliable intraday trading signals.
Strategy Tips
- Focus on high liquidity currency pairs to ensure smooth price movement and accurate signals.
- Use this strategy during active market hours to capture strong intraday trends.
- Combine with basic risk management rules, keeping risk per trade below 2% of the account balance.
- Consider additional confirmation, such as candlestick patterns, for higher probability entries.
- Track multiple Fibonacci levels to scale out profits or adjust take profit targets dynamically.
Download Now
Download the “FiboPiv_Daily_DK.mq4” indicator for Metatrader 4
FAQ
Does it repaint levels or signals?
No. Pivot points and Fibonacci levels are based on completed price data and remain fixed once plotted.
How can I use the pivot point effectively?
The pivot point represents the daily market balance.
A price closing above it suggests bullish momentum, while a closing below indicates bearish momentum.
Use it as a guide for entries, exits, and take profit planning.
Is this indicator beginner-friendly?
Yes. Its clear visual display helps beginners identify key levels easily, while experienced traders can integrate it into more advanced strategies.
Summary
The FiboPiv Daily DK Indicator for MT4 provides traders with a structured view of daily pivot points and all Fibonacci levels, simplifying entry, exit, and profit-taking decisions.
It helps in identifying potential reversals and reaction zones with high clarity.
When combined with trend confirmation or momentum indicators, it becomes a powerful tool for enhancing trade accuracy, managing risk effectively, and making well-informed trading decisions in both trending and range-bound markets.


