
About the Fibo Vector Forex Indicator
The Fibo Vector Forex Indicator for MT4 is a price action tool that uses Fibonacci vectors to identify potential trading opportunities.
It plots dynamic vector lines on the main MT4 chart, helping traders visualize market direction, momentum, and key reversal zones.
The indicator displays an upper and lower boundary along with the vector lines, giving traders a clear framework for trading entries, exits, and trend alignment.
By focusing on price interactions with these boundaries, traders can spot high-probability setups while managing risk effectively.
Its clean interface and actionable signals make it an excellent addition to any trader’s toolkit.
Free Download
Download the “Fibo-Vector.ex4” indicator for MT4
Key Features
- Plots Fibonacci vector lines directly on the MT4 chart
- Displays upper and lower boundaries for price action analysis
- Provides clear trading zones for entries and exits
Indicator Chart
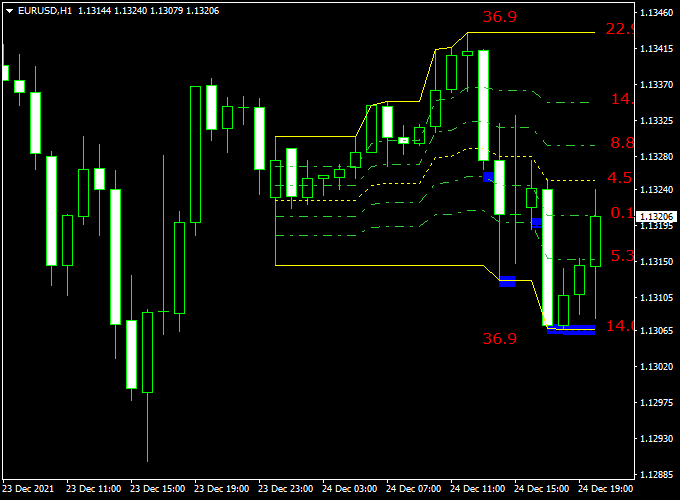
The chart example shows the Fibo Vector Indicator applied to an MT4 price chart.
The upper and lower Fibonacci vector boundaries highlight key price areas.
Price closing near or breaking these lines can signal potential bullish or bearish momentum, helping traders make timely trade decisions.
Guide to Trade with the Fibo Vector Indicator
Buy Rules
- Wait for the price to approach or bounce off the lower Fibonacci vector line.
- Look for a strong bullish candle close or a series of small consolidating candles signaling upward pressure.
- Confirm with increasing volume or a supportive trend on a higher timeframe.
- Enter a buy trade at the opening of the next candle after confirmation.
Sell Rules
- Wait for the price to reach or reverse from the upper Fibonacci vector line.
- Observe signs of selling pressure such as long wicks rejecting the level or bearish candle patterns.
- Check for divergence or trend weakness on higher timeframes for additional confirmation.
- Enter a sell trade at the start of the next candle.
Stop Loss Placement
- For buy trades, place the stop loss just below the recent swing low or lower vector boundary.
- For sell trades, place the stop loss just above the recent swing high or upper vector boundary.
- Adjust stop placement depending on volatility or major news events.
Take Profit Targets
- For buy trades, target the next vector boundary or the nearest resistance zone.
- For sell trades, target the next vector boundary or the nearest support zone.
- Consider partial exits if the price stalls near intermediate vector levels.
- Use a trailing stop to lock in profits during trending moves.
Practical Trading Tips
- Focus on trades that align with the higher timeframe trend for better reliability.
- Be cautious when price is moving sideways between the vector boundaries.
- Watch for price rejection or quick reversals at the vector lines to identify high-probability setups.
- Keep an eye on overall market volatility and avoid entering trades during major news releases.
Fibo Vector + Simpler Trend MT4 Forex Scalping Strategy
This scalping strategy combines the Fibo Vector Indicator with the Simpler Trend Indicator on MT4.
The Fibo Vector measures momentum: bullish above 8.8 and bearish below 5.3.
Simpler Trend provides early candlestick trend confirmation; green candlesticks are bullish, while red candlesticks are bearish.
This strategy works well for M1–M5 scalping on major currency pairs.
Setup
- Apply the Fibo Vector Indicator to your MT4 chart.
- Apply the Simpler Trend Indicator below the price chart.
- Trade major pairs like EUR/USD, GBP/USD, or USD/CHF for tight spreads.
- Focus on the London and New York session hours for the best volatility.
Buy Entry Rules
- Fibo Vector value is above 8.8 (bullish momentum).
- Simpler Trend forms its first green candlestick (bullish confirmation).
- Enter a buy trade at the close of the confirming candlestick.
- Stop loss: a few pips below the recent swing low.
- Take profit: next resistance level or 10–20 pips on M1–M5 charts.
- Exit early if the Fibo Vector drops below 4.5 or the Simpler Trend shows a red candlestick.
Sell Entry Rules
- Fibo Vector value is below 5.3 (bearish momentum).
- Simpler Trend forms its first red candlestick (bearish confirmation).
- Enter a sell trade at the close of the confirming candlestick.
- Stop loss: a few pips above the recent swing high.
- Take profit: next support level or 10–20 pips on M1–M5 charts.
- Exit early if the Fibo Vector rises above 4.5 or the Simpler Trend shows a green candlestick.
Advantages
- Clear momentum thresholds simplify entries and exits.
- Dual confirmation reduces false scalping signals.
- Works well on M1–M5 charts for quick profits.
- The strategy is easy to follow for beginners.
Drawbacks
- Small pip targets make spreads and slippage more impactful.
- Choppy markets may trigger false signals.
- Requires active monitoring for intraday scalping.
Case 1 — EUR/USD, 1-Minute Chart
Fibo Vector rises above 8.8, and Simpler Trend forms a green candlestick.
Entered buy at 1.1050 with a 5-pip stop loss and 15-pip take profit.
Price moves to 1.1065 within 12 minutes, hitting the target.
Case 2 — GBP/USD, 5-Minute Chart
Fibo Vector drops below 5.3, and Simpler Trend forms a red candlestick.
Entered sell at 1.2750 with a 6-pip stop loss and 18-pip take profit.
Price moves to 1.2732 within 25 minutes, achieving the target.
Case 3 — USD/CHF, 5-Minute Chart
Fibo Vector rises above 8.8, and Simpler Trend forms a green candlestick.
Entered buy at 0.9270 with a 5-pip stop loss and 15-pip take profit.
Price moves to 0.9285 within 20 minutes, reaching the take profit target.
Strategy Tips
- Only enter trades when both Fibo Vector and Simpler Trend signals align.
- Focus on major pairs for low spreads and better liquidity.
- Adjust stop loss and take profit based on pair volatility.
- Trade during the London and New York sessions for more reliable moves.
- Practice on a demo account before trading live to get familiar with fast scalping entries and exits.
Download Now
Download the “Fibo-Vector.ex4” indicator for Metatrader 4
FAQ
How do the upper and lower vector boundaries work?
The upper and lower Fibonacci vector boundaries act as dynamic support and resistance zones.
Price tends to react near these levels, providing clear points for entries, exits, or monitoring reversals.
Can Fibo Vector identify trend reversals?
Yes. When price strongly rejects a vector line or breaks through it after consolidation, it can indicate the start of a new trend or a potential reversal.
Is the indicator suitable for all market conditions?
Fibo Vector works best in trending markets, but it can also highlight short-term reaction zones during ranging or consolidating conditions, helping traders plan small swing trades.
Does the indicator require additional tools to trade?
While Fibo Vector can be used on its own, combining it with trend or momentum indicators enhances signal reliability and helps filter false breakouts.
Summary
The Fibo Vector Forex Indicator for MT4 provides traders with a clear visual representation of Fibonacci vector-based price action.
Its upper and lower boundaries give a structured framework for identifying high-probability trade zones.
This indicator simplifies trade decisions by showing where price is likely to react, whether for entries, exits, or trend confirmation.
When combined with other confirmation tools, Fibo Vector helps traders increase accuracy, manage risk effectively, and maintain consistent performance across different market conditions.


