About the All Fibonacci Pivots Forex Indicator
The All Fibonacci Pivots Forex Indicator for MT4 is a price-based trading tool that automatically plots pivot points together with Fibonacci support and resistance levels.
It is designed for traders who rely on objective market levels rather than lagging indicators.
The indicator is displayed directly in the main MT4 chart window and works purely with price action.
By combining classic pivot point logic with Fibonacci ratios, it highlights areas where price often reacts, pauses, or reverses.
These levels help traders identify potential entry zones, targets, and areas to manage risk.
It works on all currency pairs and timeframes and adapts automatically to changing market conditions.
Free Download
Download the “Fib_Pivots_02.mq4” indicator for MT4
Key Features
- Automatically plots pivot point levels on the chart
- Displays Fibonacci-based support and resistance zones
- Pure price action indicator with no lagging signals
- Appears directly in the main MT4 chart window
- Useful for entries, exits, and trade management
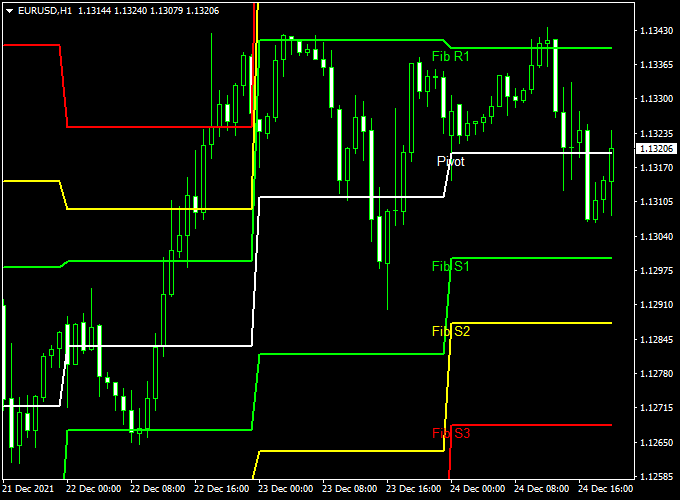
All Fibonacci Pivots Indicator Chart
The chart example shows the All Fibonacci Pivots Forex Indicator applied to an MT4 price chart.
The pivot point acts as the central market balance level, while Fibonacci support and resistance levels mark potential reaction zones where price may stall, reverse, or continue.

How to Trade with the All Fibonacci Pivots Indicator
Buy Rules
- Wait for the price to close above the pivot point level
- Confirm bullish momentum with higher highs or strong candles
- Enter a buy trade after the bullish close is confirmed
Sell Rules
- Wait for the price to close below the pivot point level
- Confirm bearish momentum with lower lows or rejection candles
- Enter a sell trade after the bearish close is confirmed
Stop Loss Placement
- Place a stop loss just below the pivot point for buy trades
- Place a stop loss just above the pivot point for sell trades
- Widen the stop slightly during high volatility sessions
Take Profit Targets
- For buy trades, target Fibonacci resistance levels R1, R2, or R3
- For sell trades, target Fibonacci support levels S1, S2, or S3
- Scale out profits as the price reaches each level
Practical Trading Tips
- The pivot point acts as a directional filter for the trading day
- Fibonacci levels are strongest during the London and New York sessions
- Avoid trading when price is stuck between nearby levels
- Use higher timeframes to identify the dominant market bias
- Combine with a trend or momentum indicator for confirmation
All Fibonacci Pivots + Stochastic Oscillator Forex Day Trading Strategy for MT4
This day trading strategy combines the All Fibonacci Pivots Indicator with the Stochastic Oscillator.
Fibonacci Pivots provide key intraday support and resistance levels, while the Stochastic Oscillator helps identify overbought or oversold conditions.
This combination is ideal for trading Gold (XAU/USD) and EUR/USD on M5–M15 timeframes during London and New York sessions.
Buy Entry Rules
- Price is above the Pivot Point (PP) or approaching a Fibonacci support level.
- Stochastic Oscillator %K line crosses above the %D line from below 20 (oversold region).
- Enter a buy trade at the close of the confirming candle.
- Stop loss: below the recent swing low or key Fibonacci support.
- Take profit: next Fibonacci resistance or a 1:2 risk-to-reward ratio.
- Exit early if the price falls below the support or the Stochastic turns back down.
Sell Entry Rules
- Price is below the Pivot Point (PP) or approaching a Fibonacci resistance level.
- Stochastic Oscillator %K line crosses below the %D line from above 80 (overbought region).
- Enter a sell trade at the close of the confirming candle.
- Stop loss: above the recent swing high or key Fibonacci resistance.
- Take profit: next Fibonacci support or a 1:2 risk-to-reward ratio.
- Exit early if price rises above resistance or Stochastic turns back up.
Advantages
- Clear support and resistance levels help define entry and exit points.
- The Stochastic Oscillator confirms momentum and filters false breakouts.
- Works well on both currency pairs and commodities like Gold.
- Suitable for intraday trading with defined risk management.
Drawbacks
- Choppy or low-volatility sessions may produce false signals.
- Targets can be small on lower timeframes, making spreads significant.
- Requires active monitoring during fast-moving markets.
Example Case 1 — XAU/USD, 5-Minute Chart
During the London session, XAU/USD is trading above the Pivot Point.
The Stochastic Oscillator is below 20, and %K crosses above %D.
Enter a buy at 1,800.00, with a 10-pip stop loss at 1,795.00 and take profit at 1,810.00.
Price reaches the target within 45 minutes for a +10 pip gain.
Example Case 2 — EUR/USD, 15-Minute Chart
During the New York session, EUR/USD is trading below the Pivot Point.
The Stochastic Oscillator is above 80, and %K crosses below %D.
Enter a sell at 1.2100, with a 10-pip stop loss at 1.2120 and take profit at 1.2020.
Price declines to the take profit level within 1 hour for a +20 pip gain.
Strategy Tips
- Trade only when both Fibonacci Pivots and Stochastic signals align.
- Use higher timeframes to confirm the overall trend before entering lower timeframe trades.
- Adjust stop loss and take profit levels according to pair volatility.
- Avoid trading during major news events to reduce whipsaws.
- Consider a trailing stop once the trade moves halfway to the target to secure profits.
Download Now
Download the “Fib_Pivots_02.mq4” indicator for Metatrader 4
FAQ
How often are the pivot and Fibonacci levels updated?
The levels are recalculated automatically at the start of each new trading session, ensuring they always reflect current market data.
Are Fibonacci pivot levels suitable for scalping?
Yes. Many scalpers use the pivot point as a directional guide and the S1/R1 levels for short-term targets during active sessions.
Can the indicator be used during strong trends?
In trending markets, Fibonacci resistance and support levels often act as continuation targets rather than reversal zones.
Does the indicator require additional confirmation?
The indicator can be used on its own, but many traders combine it with trend filters or momentum indicators to improve timing and confidence.
Summary
The All Fibonacci Pivots Forex Indicator for MT4 provides a structured and objective way to read the market using proven pivot point and Fibonacci logic.
It helps traders identify key price zones without overcrowding the chart.
When combined with a trend or momentum confirmation tool, the Fibonacci pivot levels become even more effective.
This allows traders to align direction with structure and trade with greater consistency.


