
About the Execute Line Forex Signal Indicator
The Execute Line Forex Signal Indicator is a free MT4 (Metatrader 4) tool that provides precise real-time buy and sell signals directly on the chart.
It appears in the main MT4 chart window as a bi-colored yellow and purple signal line.
The indicator is always active in the market, displaying either a buy or sell signal at any given time.
Traders can use it for direct trade entries and exits or as a confirmation filter for other strategies and systems.
With its simple color-coded design, the Execute Line Forex Signal Indicator makes identifying potential trade opportunities fast and straightforward, helping traders act quickly in dynamic markets.
Free Download
Download the “execute-line-indicator.mq4” indicator for MT4
Key Features
- Real-time buy and sell signals on the MT4 chart
- Bi-colored yellow (buy) and purple (sell) signal line
- Always active, showing either a buy or sell signal
- Can be used for entries, exits, or confirmation with other strategies
- Simple and easy-to-follow signals for scalpers and day traders
Indicator Chart
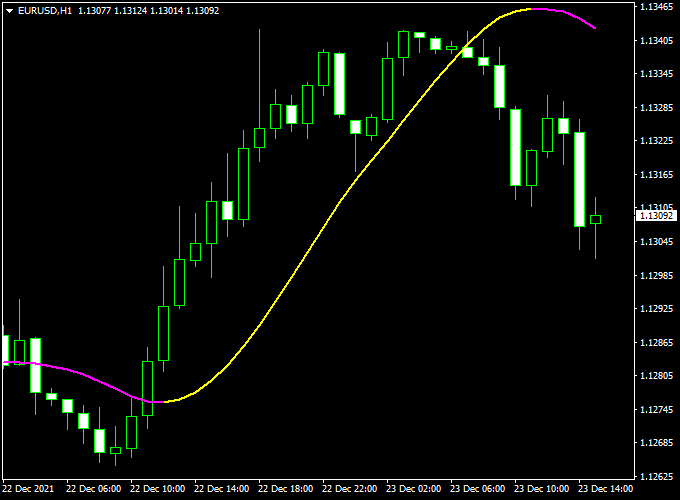
The chart below shows the Execute Line Forex Signal Indicator in action on an MT4 chart.
The yellow line signals a buy trade at its start, while the purple line signals a sell trade at its start.
Traders can follow these color changes to enter and exit trades efficiently and capture high-probability market movements.
Guide to Trade with Execute Line Forex Signal Indicator
Buy Rules
- Enter a buy trade when the yellow signal line appears
- Confirm the signal with higher timeframe analysis if needed
- Focus on trades aligned with the main trend
Sell Rules
- Enter a sell trade when the purple signal line appears
- Confirm the signal with higher timeframe trend analysis if possible
- Prefer trades aligned with the prevailing market direction
Stop Loss
- Place the stop loss a few pips beyond recent swing highs or lows
- Use tighter stops for scalping and wider stops for longer trades
Take Profit
- Exit the trade if the signal line changes color, indicating the opposite direction
Practical Tips
- Combine with trend or momentum indicators for higher accuracy
- Check higher timeframes to confirm the trend before entry
- Focus on liquid currency pairs for better reliability
- Use during active market sessions for the best results
Execute Line Signal + BOS/CHOCH Forex Indicator MT4 Strategy
This strategy pairs the Execute Line Forex Signal Indicator for MT4 with the BOS-CHOCH Metatrader 4 indicator.
The goal is simple: use market structure to define the bias and use Execute Line to time entries inside that bias.
The Execute Line gives momentum confirmation.
The method relies on checking a higher timeframe for bias and trading lower timeframe confirmations.
That keeps you aligned with the bigger move while still catching good intraday swings.
Use the system on 15m, 30m, and 1H charts. Confirm the main bias on a higher timeframe and take signals on a lower one that aligns.
This approach suits active day traders and swing traders who want clear rules and manageable risk.
Test on major pairs and liquid crosses, and keep position sizing conservative while you build confidence.
Buy Entry Rules
- Higher timeframe trend: the higher timeframe must show an uptrend or a confirmed break of structure to the upside on BOS-CHOCH.
- BOS-CHOCH should not show a recent bearish change of character after the last break of structure on the higher timeframe.
- Execute Line confirmation: wait for a yellow bullish Execute Line line close on the chosen lower timeframe.
- Entry: enter at the close of the bullish signal candle or on a small retrace to nearby support or a moving average.
- Stop loss: place SL below the most recent swing low or the recent low flagged by the Execute Line. Size the SL using ATR for the pair.
- Typical SL ranges: 20–45 pips on 15m, 40–90 pips on 1H, depending on pair volatility.
- Take profit: target 1.5x to 2.5x the risk for a single-leg trade. Consider scaling out at 1R to secure profits and leave a runner for 2R or beyond.
Sell Entry Rules
- Higher timeframe trend: the higher timeframe must show a downtrend or a confirmed break of structure to the downside on BOS-CHOCH.
- Character check: BOS-CHOCH should not show a bullish change of character after the last break of structure on the higher timeframe.
- Execute Line confirmation: wait for a purple bearish Execute Line line close on the chosen lower timeframe.
- Entry: enter at the close of the bearish signal candle or on a small pullback to resistance.
- Stop loss: place SL above the most recent swing high or the recent high flagged by the Execute Line. Use ATR to size according to pair volatility.
- Take profit: target 1.5x to 2.5x the initial risk. Use partial exits to lock gains and trail the remainder.
Advantages
- Combines market structure and momentum for clearer entries.
- Clear rules reduce hesitation and emotional decisions.
- Works on multiple timeframes and across many currency pairs.
- Easy to backtest and refine on MT4 using both indicators together.
- Scalable: you can tighten or widen stops by timeframe and ATR without changing the core rules.
Drawbacks
- Performance varies by pair and session; some pairs need wider stops or fewer trades.
- Discipline is required to stick to stops and not move them impulsively.
- Requires time to learn BOS and CHOCH identification reliably across timeframes.
Case Study 1 — EUR/USD 30m (Buy)
Setup
A higher timeframe showed a clear uptrend. BOS-CHOCH marked a break of structure to the upside.
No bearish change of character followed.
Price retraced slightly to a support zone, and an Execute Line indicator bullish line formed on the 30-minute chart.
Trade
- Entry: 1.0752 at the bullish Execute Line signal candle close on the 30m chart.
- Stop loss: 1.0702, 50 pips below entry.
- Take profit: 1.0827, 75 pips (1.5:1 R:R).
- Outcome: TP was hit after a steady run. Partial scaling at 1R improved risk management. Net +75 pips.
Case Study 2 — GBP/JPY 15m (Sell)
Setup
BOS-CHOCH showed a break of structure to the downside on the higher timeframe.
After a pullback that tested resistance, Execute Line gave a bearish signal line on the 15m chart.
Trade
- Entry: 186.20 at the bearish signal candle close.
- Stop loss: 186.65, 45 pips above entry.
- Take profit: 185.20, 100 pips (≈2.2:1 R:R).
- Outcome: partial exit at 1R, stop moved to breakeven, final TP reached later. Net +100 pips.
Strategy Tips
- Always confirm bias on a higher timeframe before trading lower timeframe signals. This reduces noise and false entries.
- Use ATR to size stops and position size. Volatile pairs need wider SLs and smaller position sizes.
- Avoid trading right before major economic releases. News can quickly flip structure and invalidate setups.
- When testing live, start with small positions or a demo account until you prove consistency.
Download Now
Download the “execute-line-indicator.mq4” indicator for Metatrader 4
FAQ
How does the Execute Line Indicator generate signals?
The indicator generates signals by changing the color of the line on the chart.
A yellow line signals a buy opportunity, while a purple line signals a sell. These signals are designed to reflect short-term momentum shifts in the market.
Can this indicator be used with other strategies?
Yes. The Execute Line Indicator can confirm entries and exits from your own strategies.
It works well with trend-following tools, support/resistance levels, or other oscillators to improve trade accuracy.
Is it suitable for scalping?
Definitely. The indicator is designed for fast-paced trading and is particularly effective during active sessions, making it ideal for scalpers and day traders.
Summary
The Execute Line Forex Signal Indicator for MT4 is a simple and efficient tool for identifying real-time buy and sell opportunities.
Its yellow and purple signal lines provide clear trading directions, making it suitable for both beginners and experienced traders.
It can be used alone or in combination with other indicators to confirm signals and improve accuracy.


