About the Ergodic Oscillator Indicator
The Ergodic Oscillator Indicator for MT4 is a free momentum-based tool designed for scalpers and day traders.
It provides short-term signals and appears in a separate MT4 chart window as a red oscillator that swings above and below the 0.00 midpoint.
The indicator highlights momentum shifts, helping traders identify potential trend reversals or continuation moves.
It can be used for direct trade entries and exits or as a confirmation filter to improve other strategies and systems.
Its simplicity and responsiveness make it a valuable tool for quick trading decisions in active markets.
Free Download
Download the “ergodic.mq4” indicator for MT4
Key Features
- Displays red histogram bars above and below the 0.00 midpoint
- Provides short-term signals for scalping and day trading
- Highlights momentum shifts and trend reversals
- Can be used alone or as a confirmation filter
- Helps traders manage entries and exits efficiently
Indicator Chart
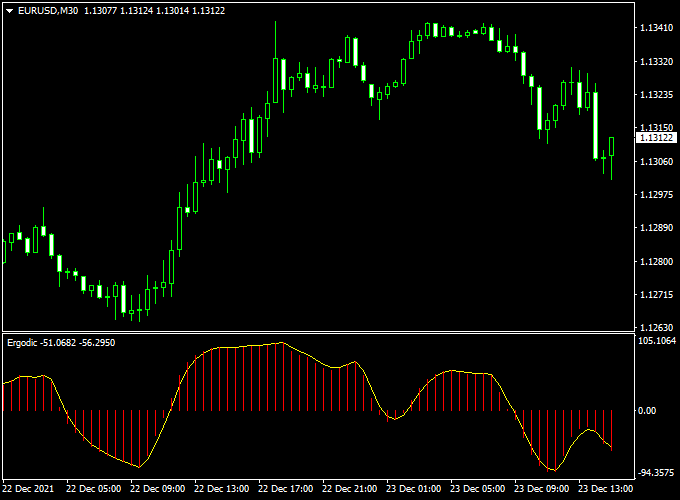
The chart below shows the Ergodic Oscillator in action on an MT4 chart window.
Red histogram bars swing above and below the 0.00 midpoint, signaling bullish and bearish momentum.
Buy and sell opportunities appear when the bars cross the midpoint, helping traders time entries and exits in trending or ranging markets.

Guide to Trade with the Ergodic Oscillator Indicator
Buy Rules
- Open a buy position as soon as the red histogram bars cross the 0.00 midpoint from bottom to top
- Confirm upward momentum with a rising histogram
- Align with the prevailing trend when possible
Sell Rules
- Open a sell position as soon as the red histogram bars cross the 0.00 midpoint from top to bottom
- Confirm downward momentum with a falling histogram
- Align with the prevailing trend when possible
Stop Loss
- Place the stop loss a few pips beyond recent swing highs or lows
- Adjust stop size depending on the timeframe and market volatility
- Use tighter stops for scalping and wider stops for swing trades
Take Profit
- Set the first target near the next support or resistance level
- Partial profits can be taken when momentum shows signs of weakening
- Extend targets in strongly trending markets
Practical Tips
- Use with trend filters like EMAs or price channels for higher accuracy
- Check higher timeframes to confirm the trend before entry
- In active sessions, follow histogram momentum closely for multiple trades per day
- Avoid relying solely on the histogram in highly volatile or news-driven periods
MT4 Day Trading Strategy: Ergodic Oscillator & Wajdyss T3 Scalper
This day trading strategy combines the Ergodic Oscillator and Wajdyss T3 Scalper indicators for MT4 to identify precise entry points in trending markets.
The Ergodic Oscillator, a momentum indicator, helps determine the strength and direction of the trend, while the Wajdyss T3 Scalper provides timely buy and sell signals.
This strategy is particularly effective on lower timeframes such as M5 and M15, making it suitable for active day traders seeking consistent profits.
Buy Entry Rules
- Ensure the Ergodic Oscillator is above the zero line, indicating bullish momentum.
- Wait for the Wajdyss T3 Scalper to display a green arrow, signaling a buy opportunity.
- Enter a buy trade at the close of the candle that confirms the green arrow signal.
- Place the stop loss just below the recent swing low to protect against potential reversals.
- Set a take profit target at a risk-reward ratio of 1:2, or exit the trade when the Ergodic Oscillator starts to decline.
Sell Entry Rules
- Confirm that the Ergodic Oscillator is below the zero line, indicating bearish momentum.
- Wait for the Wajdyss T3 Scalper to display a red arrow, signaling a sell opportunity.
- Enter a sell trade at the close of the candle that confirms the red arrow signal.
- Place the stop loss just above the recent swing high to mitigate potential losses.
- Set a take profit target at a risk-reward ratio of 1:2, or exit the trade when the Ergodic Oscillator starts to rise.
Advantages
- Combines momentum analysis with precise entry signals for improved trade accuracy.
- Suitable for trending markets, allowing traders to capitalize on sustained price movements.
- Provides clear buy and sell signals, reducing decision-making time.
- It can be adapted to various currency pairs and timeframes, offering flexibility in trading strategies.
Drawbacks
- Requires consistent discipline to avoid chasing trades during small retracements.
- Performance can be affected by sudden news events, causing unexpected reversals.
- Indicators may lag during extremely volatile market conditions, leading to delayed entries.
Case Study 1
On a 5-minute AUD/USD chart, the Ergodic Oscillator was above the zero line, indicating bullish momentum.
The Wajdyss T3 Scalper displayed a green arrow, signaling a buy opportunity.
The trader entered the trade at the close of the confirming candle, placed the stop loss below the recent swing low, and set a take profit target at twice the risk.
The trade was successful, yielding a profit as the price continued to rise.
Case Study 2
On a 15-minute USD/JPY chart, the Ergodic Oscillator was below the zero line, indicating bearish momentum.
The Wajdyss T3 Scalper displayed a red arrow, signaling a sell opportunity.
The trader entered the trade at the close of the confirming candle, placed the stop loss above the recent swing high, and set a take profit target at twice the risk.
The trade reached the take profit level as the price continued downward.
Strategy Tips
- Use higher timeframes (e.g., M30 or H1) to confirm the overall trend direction before taking trades on lower timeframes.
- Focus on currency pairs with high liquidity to reduce slippage and improve trade execution.
- Combine this strategy with support and resistance levels to strengthen trade confirmation.
Download Now
Download the “ergodic.mq4” indicator for Metatrader 4
FAQ
What does the Ergodic Oscillator measure?
It measures short-term momentum and trend strength using a smoothed histogram that swings above and below the 0.00 midpoint.
This helps traders spot reversals and continuation moves in fast-moving markets.
Which timeframe works best with this indicator?
The indicator works on all timeframes, but H1–H4 are ideal for clearer signals.
Lower timeframes are suitable for scalping but may produce more false crossovers.
Can it be used for both entry and exit?
Yes. The Ergodic Oscillator can be used to open trades when histogram bars cross the 0.00 midpoint and close trades when momentum shifts or bars cross in the opposite direction.
Summary
The Ergodic Oscillator Indicator for MT4 is a reliable tool for scalpers and day traders seeking quick momentum signals.
Its red histogram visually represents shifts above and below the 0.00 midpoint, making entry and exit decisions straightforward.
It can be used alone or in combination with other trend or momentum indicators for enhanced accuracy.
Traders who follow its signals systematically can capture multiple profitable setups daily while maintaining disciplined risk management.


