
About the EMA Trend Forex Indicator
The EMA Trend Forex indicator for MetaTrader 4 is a free tool designed to help traders identify and follow market trends using exponential moving averages.
The indicator converts the slope and position of the EMA into actionable buy and sell signals, making trend identification fast and practical.
Displayed as a colored EMA line on the main MT4 chart, the indicator provides visual cues for both bullish and bearish trends.
Traders can quickly see when the market momentum shifts, helping them make informed trade decisions.
The EMA Trend indicator can be used as a standalone tool for entries or as a confirmation alongside other indicators and strategies, including oscillators or price action setups.
Free Download
Download the “ema-trend-indicator.mq4” indicator for MT4
Key Features
- Colored EMA trend line displayed on the main MT4 chart
- Identifies bullish and bearish trends based on EMA slope and position
- Can be used for trade entries or as confirmation for other strategies
- Helps traders follow trends with minimal complexity
- Optimized for day trading and scalping during high-liquidity sessions
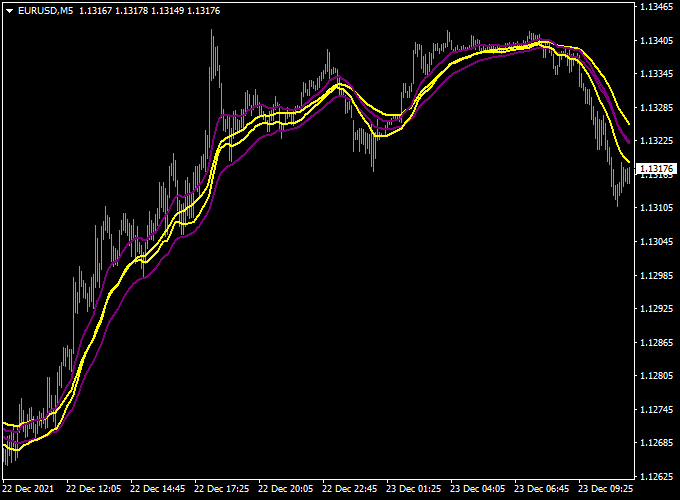
Indicator Chart
The chart below shows the EMA Trend Forex indicator in action.
The colored EMA line tracks the prevailing trend, with upward slopes indicating bullish conditions and downward slopes signaling bearish momentum.
Traders can align their entries with the trend for higher-probability setups.
Guide to Trade with EMA Trend Forex Indicator
Buy Rules
- Wait for the EMA lines to slope upward
- Confirm bullish momentum with supporting price action
- Open a buy trade aligned with the trend
Sell Rules
- Wait for the EMA lines to slope downward
- Confirm bearish momentum with supporting price action
- Open a sell trade aligned with the trend
Stop Loss
- Place stops below recent support for buy trades and above resistance for sell trades
- Combine support/resistance placement with a fixed stop distance for consistent risk
Take Profit
- Target the next visible support or resistance area in the trade direction
- Adjust targets based on market volatility and timeframe
EMA Trend + SuperTrend MTF MT4 Strategy
This strategy merges the EMA Trend Forex Indicator (MT4) with the SuperTrend MTF Forex Signal Indicator (MT4).
The idea is to use the EMA Trend indicator to gauge direction and trend strength, and then use the Multi-Timeframe SuperTrend to confirm entries.
This approach works on multiple timeframes and helps filter out bad trades.
Intro
The EMA Trend indicator calculates moving averages or trend lines to show whether the price is in an uptrend or a downtrend.
The SuperTrend MTF indicator overlays trend signals from higher timeframes, smoothing noise, and giving confirmation when multiple timeframes align.
Together, they reduce false signals.
You can apply this to M15, M30, H1, and even H4.
For intraday traders, M15/M30 is ideal. For swing traders, H1/H4 gives stronger moves.
It’s for traders who prefer trend-following with filtered entry triggers rather than relying on a single signal.
Buy Entry Rules
- EMA Trend must indicate the market is in an uptrend; the 4 EMAs are rising.
- SuperTrend MTF must show a green bullish line.
- Price should pull back toward the EMA or trend region, then resume upward with a bullish candle closing above the pullback.
- Enter at the close of that bullish confirmation candle.
- Stop loss: place below the swing low or below the EMA or trend line that acted as support.
- Take profit: target 1.5× to 2× the risk, or aim for the next resistance region or trend barrier indicated by SuperTrend or EMA trend zones.
Sell Entry Rules
- EMA Trend must be showing a downtrend; the 4 EMAs are declining.
- SuperTrend MTF must show a red bearish line.
- Price should retrace upward toward the EMA or trend line, then resume downward with a bearish candle closing below the retracement.
- Enter on that bearish candle close.
- Stop loss: place above the recent swing high or above the EMA/trend resistance area.
- Take profit: aim for 1.5× to 2× risk or go for the next support zone or trend barrier.
Advantages
- Dual confirmation from the trend indicator and the multi-timeframe SuperTrend reduces whipsaws.
- Flexible across multiple timeframes.
- Clear entry zones when price pulls back into trend.
- Allows you to trade in the direction of higher timeframe momentum.
Drawbacks
- In sideways markets, signals may be rare or ineffective.
- Lag between signal alignment can cause late entries.
- A large stop loss may be needed in volatile pairs or timeframes.
Example Case Study 1 — M15 EURUSD (Intraday)
On M15, the EMA Trend showed an upward slope. SuperTrend MTF signaled “buy” on M15 and on H1.
Price pulled back to EMA, then a bullish candle closed above the pullback.
A buy entry was taken. Stop placed below the pullback low.
TP set to 1.8× risk and into the next resistance.
Example Case Study 2 — H1 GBPUSD (Swing Trend)
On H1, the EMA Trend indicated downward movement. SuperTrend MTF signaled “sell” on H1 and on H4.
Price retraced upward to touch the trend area, then a bearish candle closed below.
Entry taken. Stop above the swing high. TP target was the next support area.
The trade ran for several hours and reached the target.
Strategy Tips
- Use pairs with good volatility and small spreads.
- Avoid trading in news or high-impact times when whipsaw risk is high.
- Trade only when both indicators strongly agree.
- Do partial exits or move stop to breakeven once risk multiple is achieved.
Download Now
Download the “ema-trend-indicator.mq4” indicator for Metatrader 4
FAQ
Can the EMA Trend indicator be combined with other tools?
Yes, it can be used alongside oscillators, Stochastic, or higher-timeframe analysis to improve entry accuracy and filter false signals.
Which currency pairs work best?
The indicator is effective on all currency pairs, including majors, minors, and exotic pairs.
Is EMA Trend suitable for day trading?
Yes, it performs best during London and U.S. trading sessions when volatility and liquidity are higher.
Summary
The EMA Trend Forex indicator is a reliable MT4 tool that helps traders follow market trends efficiently.
Its colored EMA line highlights bullish and bearish momentum, allowing traders to align trades with the prevailing trend.
When combined with the SuperTrend MTF for confirmation, the indicator supports consistent trend-following strategies and improves trade accuracy.
Its simplicity and versatility make it suitable for all currency pairs and multiple timeframes, helping traders make informed decisions while managing risk effectively.


