
About the Elliott Waves Oscillator Indicator
The Elliott Waves Oscillator is a free MetaTrader 4 indicator designed to help traders identify market momentum using a histogram based on Elliott Wave principles.
It plots a colored histogram in a separate MT4 window that moves above and below the 0.00 level, making trend shifts and momentum changes easy to follow in real time.
This indicator focuses on the difference between fast and slow moving averages to measure bullish and bearish pressure.
When momentum strengthens, histogram bars expand in the direction of the move.
When momentum weakens, the bars contract and often signal a possible correction or reversal.
The Elliott Waves Oscillator is especially useful for scalping and day trading, where timing entries and exits is critical.
Free Download
Download the “Elliott_Wave_Oscillator.mq4” indicator for MT4
Key Features
- Histogram-based oscillator displayed in a separate MT4 window
- Oscillates above and below the 0.00 level to show momentum shifts
- Suitable for scalping, intraday trading, and short-term swing trades
- Works on all forex pairs and timeframes
- Can be used for trade entries, exits, or signal confirmation
- Simple logic that is easy to combine with other strategies
Indicator Chart
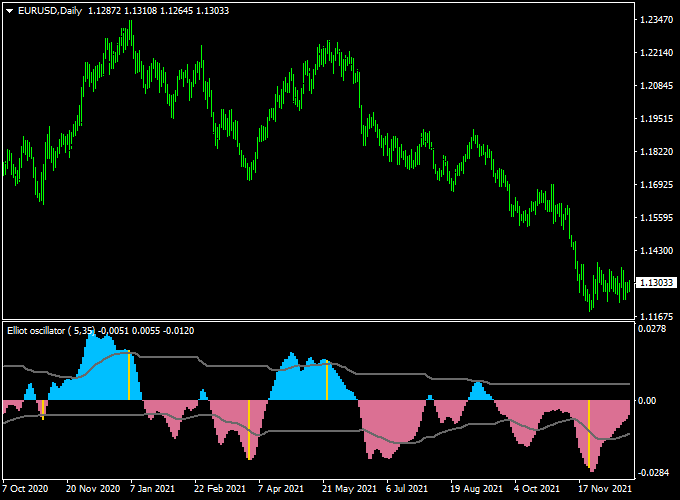
The chart below shows the Elliott Waves Oscillator indicator applied to a forex chart.
The histogram bars move above and below the zero line, reflecting bullish and bearish momentum.
Buy opportunities appear when momentum turns positive, while sell opportunities form when momentum shifts to the downside.
Guide to Trade with Elliott Waves Oscillator
Buy Rules
- Wait for the histogram to move below the 0.00 level
- Enter a buy trade when the bars turn back above the 0.00 line
- Confirm the entry with bullish price action or trend direction
Sell Rules
- Wait for the histogram to move above the 0.00 level
- Enter a sell trade when the bars turn back below the 0.00 line
- Look for bearish price action or resistance near the entry
Stop Loss
- Set the stop loss to a fixed number of pips based on the traded timeframe
- On lower timeframes, use a tighter stop aligned with recent volatility
- For higher timeframes, allow more room to avoid premature exits
Take Profit
- Set the take profit at the next support or resistance level
- Exit partially when the histogram starts losing momentum
- Close the trade if the histogram crosses back over the 0.00 level
Elliott Waves Oscillator + Trend Predictor V1.0 MT4 Strategy
This MT4 strategy combines the Elliott Waves Oscillator with the Trend Predictor V1.0 Forex Indicator.
It is designed to identify strong trend reversals and continuations by confirming wave structure with predictive signals.
This approach works well on major currency pairs, such as EUR/USD, GBP/JPY, and AUD/CAD.
It suits both swing traders and day traders who prefer clear entry and exit points with minimal lag.
The Elliott Waves Oscillator helps spot potential wave 3 and wave 5 entries, while the Trend Predictor V1.0 plots early reversal or continuation arrows.
When used together, they filter out weak signals and improve win rates.
Higher timeframes, such as H1 and H4, give fewer but stronger signals, while M15 and M30 allow more frequent trades with tighter stops.
Buy Entry Rules
- The Elliott Waves Oscillator shows a strong blue positive reading, indicating an impulsive wave up.
- The Trend Predictor V1.0 prints a blue up arrow below the price candle, confirming bullish momentum.
- Enter a buy trade at the open of the next candle after confirmation.
- Place a stop loss 25–35 pips below the most recent swing low.
- Set a take profit of 50–80 pips or aim for the next major resistance level.
Sell Entry Rules
- The Elliott Waves Oscillator shows a strong red negative reading, indicating an impulsive wave down.
- The Trend Predictor V1.0 prints a red down arrow above the price candle, confirming bearish momentum.
- Enter a sell trade at the open of the next candle after confirmation.
- Place a stop loss 25–35 pips above the most recent swing high.
- Set a take profit of 50–80 pips or aim for the next major support level.
Advantages
- Combines wave analysis with predictive arrows for more accurate entries.
- Works across multiple timeframes and currency pairs.
- Clear and simple rules suitable for both new and experienced traders.
- Helps catch early trend reversals with defined risk.
Drawbacks
- Signals can lag during very volatile news events.
- Requires discipline to wait for full confirmation from both indicators.
- Performance varies depending on market conditions.
Case Study 1: GBP/JPY on H1
On GBP/JPY H1, the Elliott Waves Oscillator turned sharply positive, suggesting a strong impulsive wave 3.
Shortly after, the Trend Predictor V1.0 plotted a blue up arrow below the candle at 188.40.
A buy was taken at 188.45 with a stop loss at 188.05 (40 pips).
Price rallied to 189.25 within four hours for an 80 pip gain.
The combined confirmation avoided a previous false breakout and locked in a high-probability move.
Case Study 2: AUD/CAD on M30
On AUD/CAD M30, the Elliott Waves Oscillator dropped below zero, showing a potential new impulsive wave down.
The Trend Predictor V1.0 then printed a red down arrow at 0.9080.
A sell trade was entered at 0.9075 with a stop loss at 0.9105 (30 pips).
The price fell to 0.9020 over the next three sessions, resulting in a 55-pip gain.
This example highlights how the setup can capture clean moves even on cross pairs outside the majors.
Strategy Tips
- Use higher timeframes to reduce noise and increase accuracy.
- Avoid trading during major economic releases as volatility can trigger false signals.
- Combine this approach with simple support and resistance analysis to find the best take profit levels.
- Always test the setup on a demo account before applying it to a live account.
- Adjust stop loss and take profit distances according to the volatility of the chosen pair.
Download Now
Download the “Elliott_Wave_Oscillator.mq4” indicator for Metatrader 4
FAQ
On which timeframe does the Elliott Waves Oscillator work best?
The indicator performs well on lower timeframes such as M5, M15, and M30 for scalping and day trading. It can also be used on H1 and H4 for traders who prefer fewer signals.
Can the Elliott Waves Oscillator be used alone?
Yes, it can be traded on its own using zero-line cross signals. Many traders also combine it with trend-following tools to improve timing and reduce false entries.
Does the indicator repaint?
The Elliott Waves Oscillator does not repaint completed bars. Once a histogram bar is closed, its value remains fixed, allowing reliable signal analysis.
Is the indicator suitable for beginners?
Yes, the logic behind the oscillator is easy to understand. Beginners can focus on zero-line crossings, while more experienced traders can use momentum strength for advanced trade management.
Summary
The Elliott Waves Oscillator is a practical MT4 indicator for traders who want to trade momentum with confidence.
Its histogram display makes it easy to read market pressure and identify potential buy and sell opportunities across all forex pairs.
The indicator is flexible, beginner-friendly, and effective for both fast-paced scalping and intraday trading.
Traders who invest time in understanding its signals often find that it improves both timing and trade management.


