
About the DoubleRect Indicator
The DoubleRect Forex Indicator for MT4 is a visual trading tool that uses blue/red rectangle-shaped zones to highlight potential buy and sell areas on your chart.
It identifies key support and resistance levels, plotting rectangles around zones where price has historically reversed or consolidated.
By focusing on these areas, the indicator helps traders recognize high-probability entries and exits without cluttering the chart with too many lines or signals.
Free Download
Download the “doublerect-indicator.mq4” indicator for MT4
Key Features
- Automatically draws rectangles around key support and resistance zones.
- Highlights potential buy and sell areas for easier trade identification.
- Supports multiple timeframes from M1 to D1.
- Works on all major and minor currency pairs.
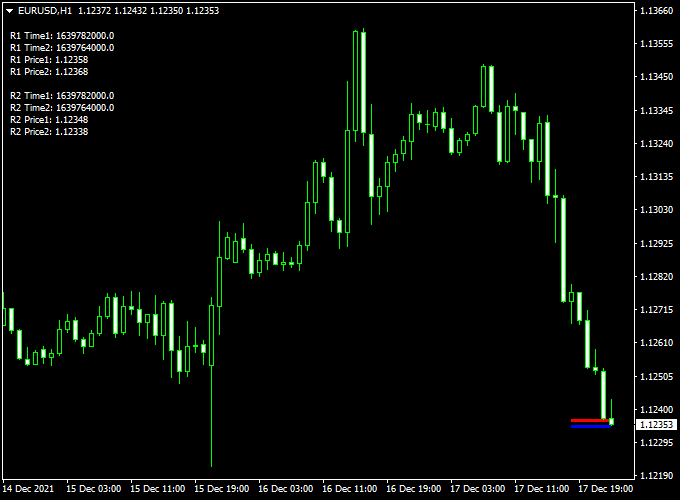
Indicator Chart (EUR/USD H1)
The chart example below illustrates how DoubleRect identifies potential trading zones.
Blue/red rectangles are drawn around areas of price consolidation or reversal, showing traders where to focus for possible entries.
DoubleRect + XP Moving Average MT4 Strategy
This MT4 strategy merges the geometric rectangle zones from the DoubleRect indicator with the trend smoothing power of the XP Moving Average.
DoubleRect highlights price consolidation rectangles and breakout zones.
XP Moving Average filters trend direction and helps confirm valid breakout momentum.
Intro
Apply this method to H1 and H4 charts. H1 gives more frequent signals, while H4 filters stronger trends and reduces noise.
It’s ideal for traders who like trading breakouts but also want trend confirmation. Use it on major currency pairs or liquid, volatile markets.
Buy Entry Rules
- Identify a rectangle zone drawn by DoubleRect where the price consolidates.
- Wait for a bullish breakout.
- Confirm that the XP Moving Average is sloping upward and the price is above it.
- Enter at the candle close after breakout confirmation.
- Stop loss is placed below the recent swing low.
- Take profit: twice the risk taken.
Sell Entry Rules
- Locate the rectangle zone where the price is consolidating.
- Wait for a bearish breakout below the bottom boundary.
- Confirm that the XP Moving Average is sloping downward and the price is below it.
- Enter on the close of the breakout candle.
- Stop loss above the rectangle’s top or recent swing high.
- Take profit: aim for twice the risk taken.
Advantages
DoubleRect visually defines zones so you don’t guess support/resistance.
The XP Moving Average acts as a trend filter, preventing countertrend entries and confirming breakout strength.
- Helps avoid false breakouts by requiring trend confirmation.
- Simple rules, clear entry, stop, and target points.
- Suits both swing and intraday trading styles.
Drawbacks
The trend filter might delay entries or miss early moves.
- Lower frequency of trades due to strict confirmation rules.
- False breakouts are possible, especially without strong momentum.
Example Case Study 1 — H1 EUR/USD Long
In an H1 time frame, EURUSD formed a rectangle between 1.1000 and 1.1050.
Price broke above 1.1050 with a strong candle. The XP Moving Average was sloping upward, and the price was above it.
Entry taken at close. Stop was set below 1.1000. Target matched the rectangle height of 50 pips.
Example Case Study 2 — H4 GBP/JPY Short
On H4, GBPJPY consolidated between 149.50 and 151.00. A bearish candle broke below 149.50.
The XP Moving Average was trending downward, and the price was below it.
Entry at close. Stop above 151.00. Target – rectangle height of 150 pips.
Trade trailed lower until reversal flipped direction, closing part early and locking profit.
Strategy Tips
- Trade in the direction of the higher timeframe trend. Use the daily trend to guide bias.
- Measure the rectangle height and use it for profit targets.
- If breakout is weak (small candle, weak momentum), skip it.
Download Now
Download the “doublerect-indicator.mq4” indicator for Metatrader 4
Indicator Specifications
| Specification | Detail |
|---|---|
| Platform | MetaTrader 4 (MT4) |
| File type | MQ4 / EX4 |
| Timeframes | All timeframes (M1 to D1) |
| Pairs | All major and minor forex pairs |
| Inputs | Lookback period, rectangle sensitivity, alert options, display settings |
| Default settings | Optimized for major currency pairs |
| License | Free download |
FAQ
Can DoubleRect be used for scalping?
Yes, by applying it to lower timeframes such as M1 or M5, traders can identify quick support and resistance zones suitable for scalping.
Does it work on all currency pairs?
Yes, DoubleRect works on all major, minor, and cross pairs, but adjusting sensitivity may improve performance for volatile pairs.
Is it suitable for swing trading?
Absolutely. Using higher timeframes like H1 or H4 allows the indicator to highlight zones for longer-term trades.
Summary
The DoubleRect Forex Indicator provides a simple yet effective way to visualize potential support and resistance zones.
Highlighting key areas as rectangles allows traders to quickly identify potential buy and sell opportunities.
This helps reduce confusion on busy charts and improves trade planning.
Combining the indicator with other confirmation tools and proper risk management enhances its effectiveness.


